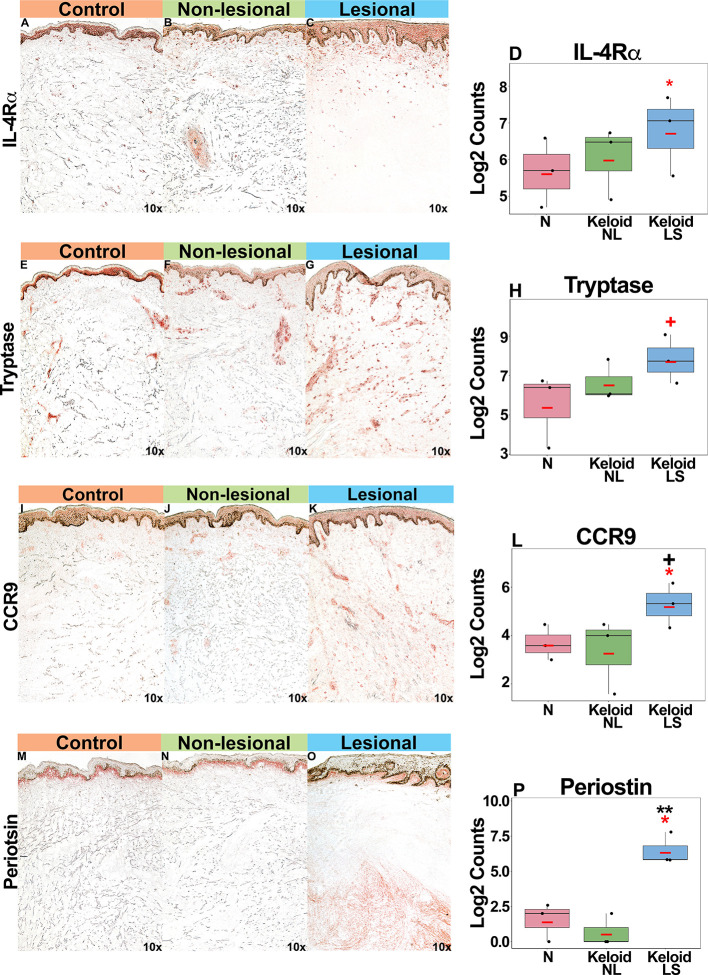
Figure 4.
Representative immunohistochemistry images and corresponding cell count quantification of IL-4Rα+ cells (A–D), tryptase+ mast cells (E–H), CCR9+ cells (I–L) and periostin+ cells (M–P) in normal skin from controls, and lesional and non-lesional skin of keloid patients, viewed at 10x magnification. Red bar represents mean. Black symbols: significance of comparison to normal; red symbols: significance of comparison between lesional and non-lesional skin. **P < 0.01, *P < 0.05, + P < 0.1. LS, lesional; NL, non-lesional; N, normal.

