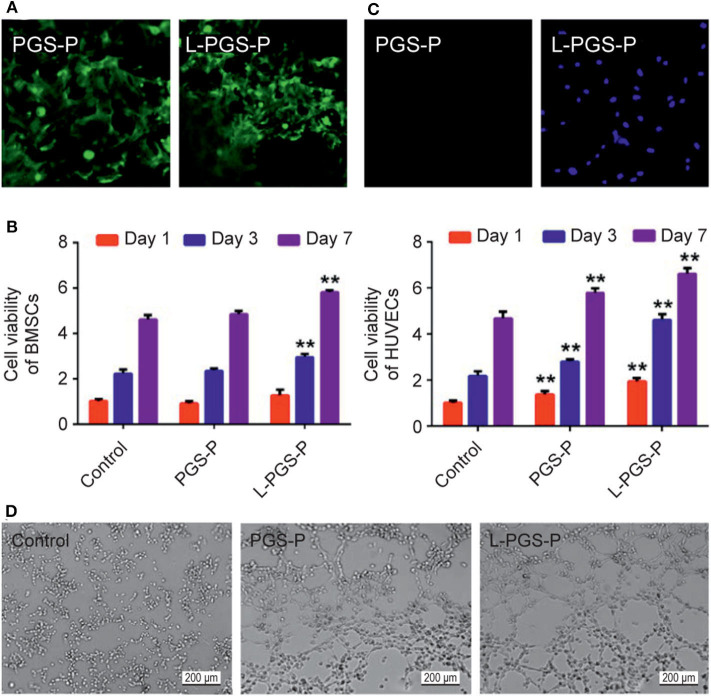
Figure 3.
Cellular behavior on different scaffolds. (A) Cell adhesion activity of PGS-P and L-PGS-P scaffolds illustrated in a 40x magnification picture. (B) The proliferation rate of the two kinds of adhered cells on day 1, 3, and 7 was tested using an MTT assay. (C) Cell infiltration was observed by DAPI staining. L-PGS-P scaffold supports cell infiltration of HUVECs in vitro; 20x magnification picture was captured at cross section. (D) Representative images of tube formation for 6 h with different medium from scaffolds soak liquid (soak for 7 days). **P < 0.01, compare with control group at different time point.

