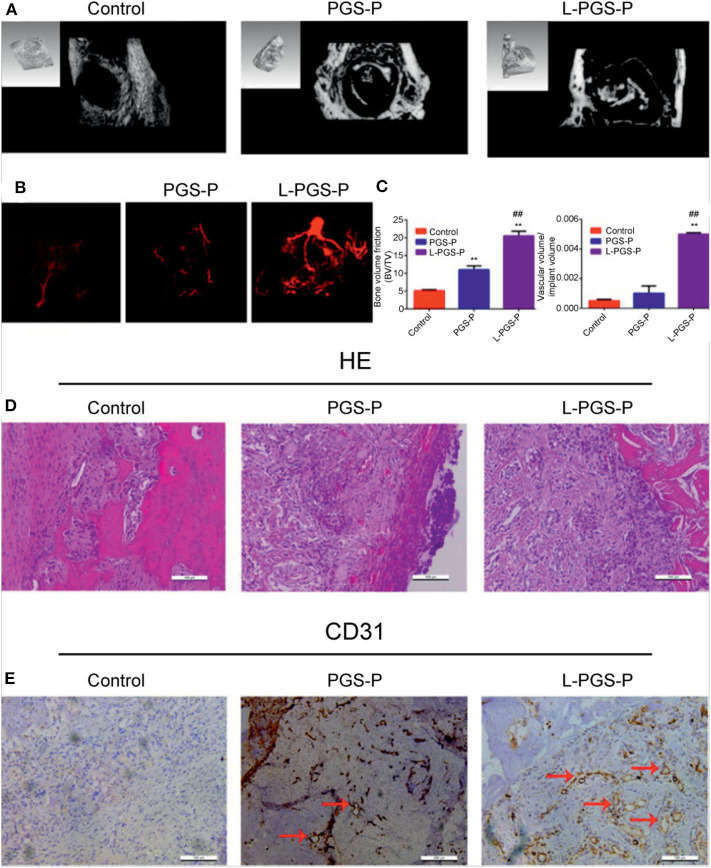
Figure 5.
The proangiogenic and osteogenic performance of PGS-P and L-PGS-P scaffolds in vivo. (A) Representative computed tomography reconstruction images of the defects shows abundant mineralized tissues in L-PGS-P than PGS-P at 2 weeks after implantation. (B) Micro-computed tomography images of vessel in rat distal femur defects perfused with Microfil radio-opaque contrast agent. L-PGS-P implants showed vasculature in surrounding tissue growing into implant, but not in the PGS-P and control groups. (C) Bone volume fraction and quantification of vascular volume/total implant volume. (D,E) haematoxylin and eosin (D) and CD31 staining (E) was performed at 2 weeks after implantation to evaluate the vessel and bone formation. Remarkably, more mineralized tissue and CD31-positive cells were found in L-PGS-P than PGS-P. Red arrows indicate positively stained areas of CD31-positive blood vessels. **P < 0.01, compare with control group; ##P < 0.01, compare with PGS-P group.

