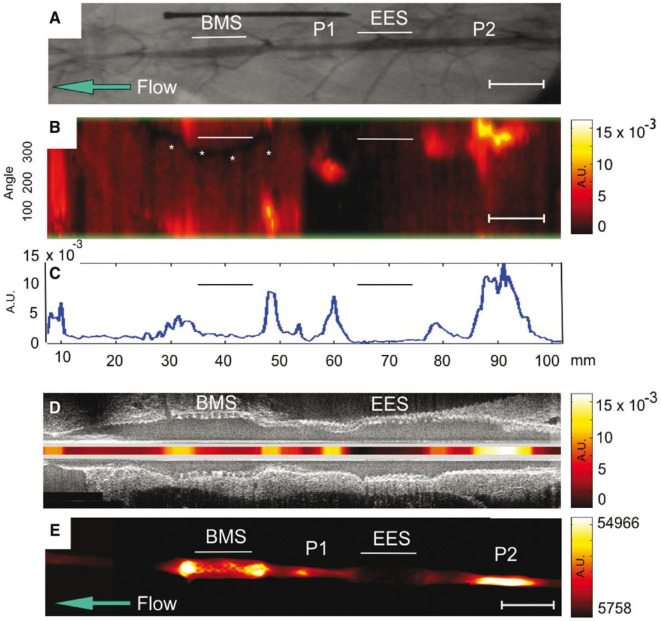
Figure 6.
NIRF molecular imaging of stent suppresion of plaque inflammation. In vivo and ex vivo imaging of rabbit aorta demonestrating inflammatory protease activity in bare metal stent (BMS)-, everolimus-eluting stent (EES)-treated, and unstented plaque zones. (A) Angiogram of the abdominal aorta, showing positions of BMS and EES. Areas of IVUS–visible plaque areas (P1 and P2 zones) are highlighted. (B) In vivo NIRF imaging, demonestrating increased signal intensity in areas corresponding to BMS. The y-axis represents the angular dimension (0–360°). The x-axis represents the longitudinal/axial dimension in millimeters. The asterisk denotes a guidewire artifact. (C) Averaged mean NIRF signal (unidimentional) along the longitudinal axis. NIRF signal is higher in unstented regions > BMS regions > EES regions (D) Co-reistered longitudinal IVUS and intravascular NIRF images. (E) Ex vivo FRI at 800 nm of the resected aorta, demonestrating higher signal in BMS region, compared to EES region. AU, arbitrary units; Scale bar, 10 mm. Calfon Press et al. (12), by permission of European Society of Cardiology. License number: 4720551036244.

