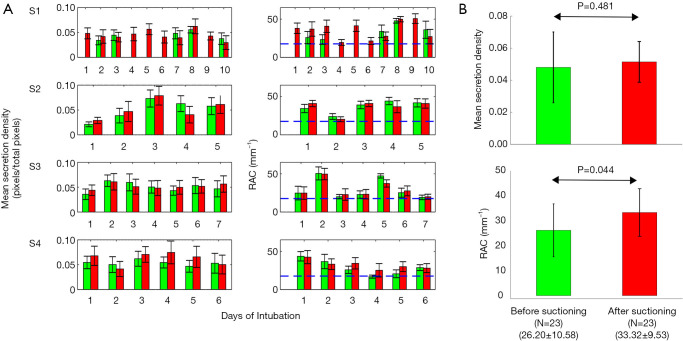
Figure 3.
Quantitative analysis of ETTs based on secretion density and RAC metrics. (A) Quantitative analysis of ETTs based on secretion density (left column) and RAC metrics (right column) for all subjects (S1–4) from the day of intubation until extubation. The bar plots in green represent before suctioning and the bar plots in red represent after suctioning. (B) Measured average overall RAC values, secretion density, standard deviations, and statistical analysis presented by group. The blue dashed line in (A) corresponds to the threshold obtained from a bimodal distribution method to separate the signal from biofilm positive data. ETT, endotracheal tube; RAC, relative attenuation coefficient.

