
Figure 4.
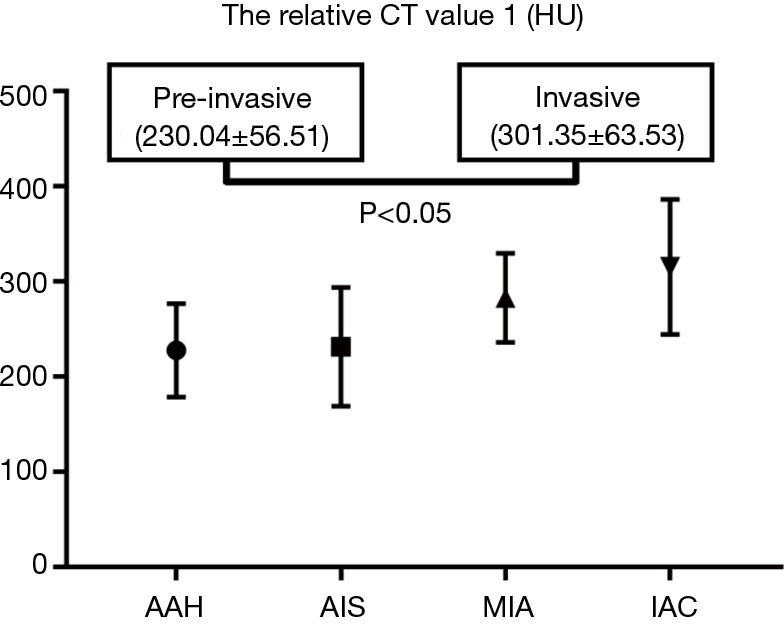
Plot of the relative CT value 1 in atypical adenomatous hyperplasia (AAH), adenocarcinoma in situ (AIS), minimally invasive adenocarcinoma (MIA), and invasive adenocarcinoma (IAC) appearing as pure ground-glass nodules. CT, computed tomography; HU, Hounsfield units.