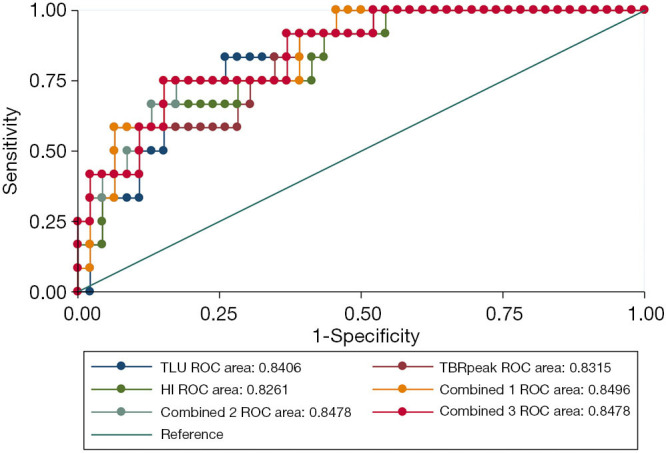
Figure 1.

Predictive efficacy comparisons of the top 3 single-parameter models and top 3 multiple-parameter models between glioma grade II or III and grade IV. Receiver-operating characteristic curve analysis showed that total lesion tracer standardized uptake (TLU), peak tumor-to-background ratio, and heterogeneity index (HI) had the top 3 single-parameter model performance in glioma grade prediction; area under the curve (AUC) was 0.841, 0.832, and 0.826, respectively. Combined model 1 was the combination of maximal tumor-to-background ratio, the standard deviation of lesion standardized uptake value (SUVsd), and mean tumor-to-background ratio; AUC was 0.850. Combined model 2 was the combination of HI, SUVsd, and metabolic tumor volume; AUC was 0.848. Combined model 3 was the combination of HI, SUVsd, and TLU; AUC was 0.848.
