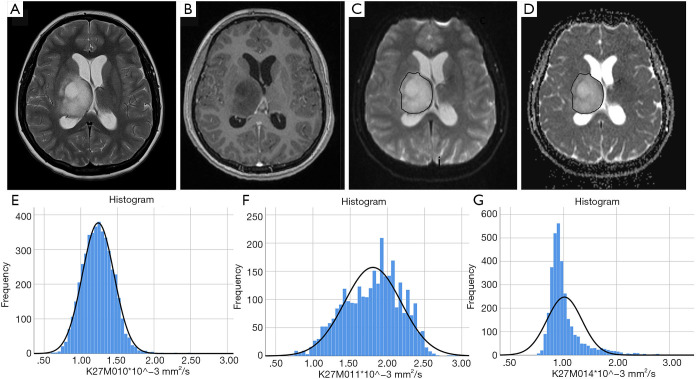
Figure 2.
ADC histograms in H3 K27M histone-mutant glioma. T2w image (A), post gadolinium T1w image (B), b0 DWI image (C) and ADC map (D) demonstrating an example of glioma volumetric segmentation (case 10). Segmentations were performed on the b0 images under view of the corresponding anatomical sequences, then copied onto the ADC maps in Olea Sphere v2.3 (Olea Medical). Images (E,F,G) show ADC histograms in 3 different patients (case 10, case 11 and case 14). ADC, apparent diffusion coefficient.

