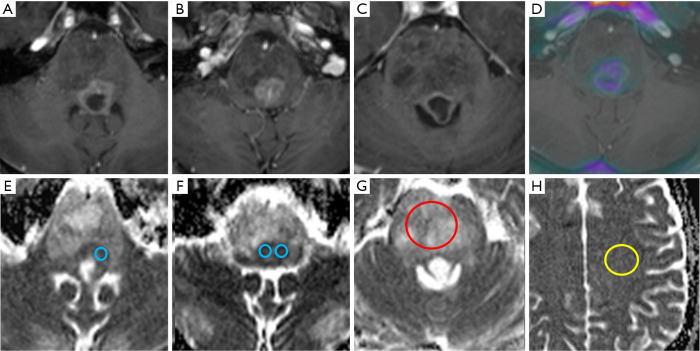
Figure 6.
Quantitative ADC measurement in H3 K27M histone-mutant glioma. T2w (A,B), post gadolinium T1w (C) and T1w/18F choline PET fusion image (D) demonstrating a partially necrotic H3 K27M-mutant diffuse midline glioma (case 3) with considerable signal heterogeneity on all image sequences. ADC maps in the same patient featuring superimposed ADCmin (E,F), ADCmean (G) and ADCNAWM (H) regions of interest (ADCmin=blue, ADCmean=red, ADCNAWM=yellow). ADC, apparent diffusion coefficient.

