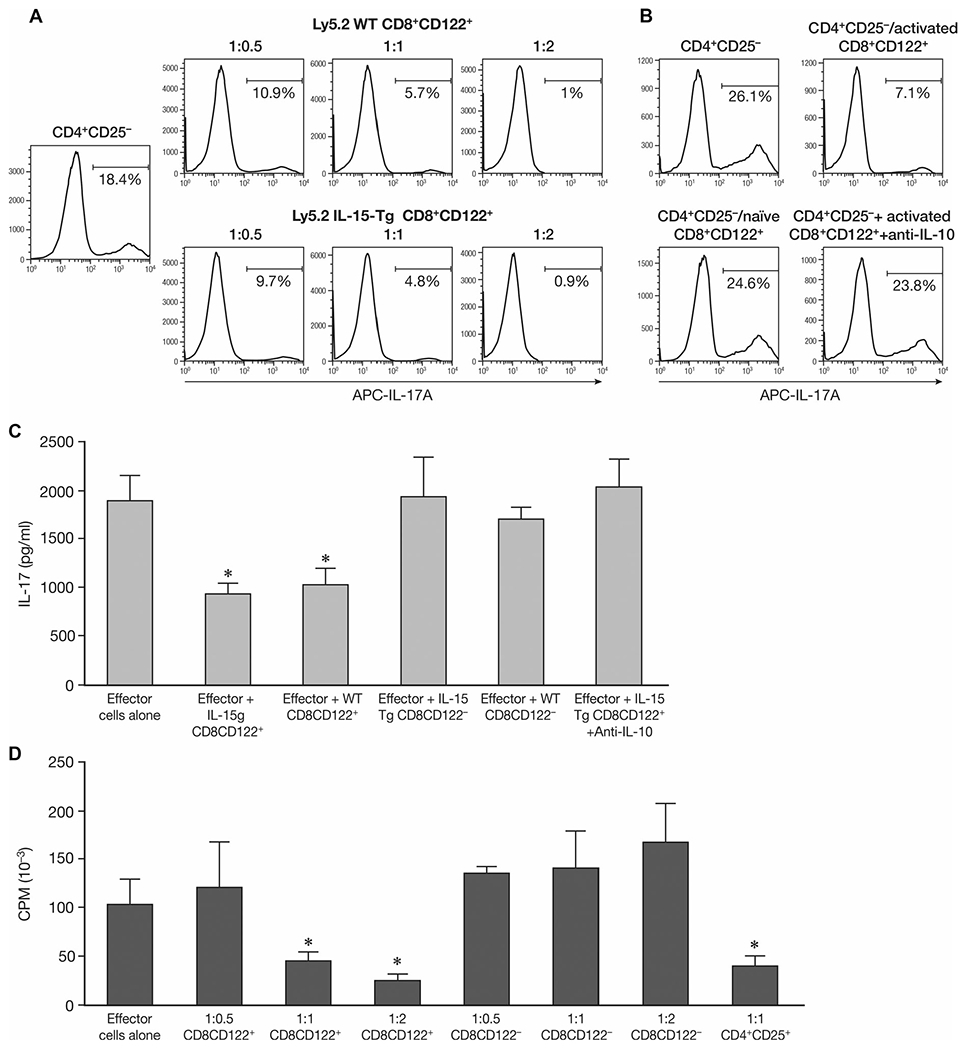
Figure 6.

Effect on Th17-cell generation and effector T-cell proliferation by CD8+CD122+ T cells in vitro. (A) Effect on Th17-cell generation by coculturing CD8+CD122+ T cells with effector CD4+CD25− T cells. Naïve CD4+CD25− T cells from Ly5.1 C57BL/6 mice were stimulated under Th17 conditions. Different ratios of effector cells to CD8+CD122+ T cells either from naïve Ly5.2 wild type C57BL/6 (Ly5.2 WT) or from Ly5.2 IL-15 transgenic C57BL/6 mice (Ly5.2 IL-15-Tg) were cocultured with CD4+CD25− T cells for 4 days. The percentage of TM7 cells was detected by intracelluar staining for IL-17A by flow cytometry. (B) Effect on Th17-cell generation by naive CD8+CD122+ T cells in vitro. Instead of coculture with CD4+CD25− T cells for 4 days, the CD8+CD122+ T cells from Ly5.2 IL-15-Tg mice were provided on day 3 and continued with the following procedures to generate and detect Th17 cells (CD4+CD25−/naïve CD8+CD122+). Selected groups were cultured with CD8+CD122+ T cells for 4 days along with 10 μg/mL anti-IL-10 (CD4+CD25−+activated CD8+CD122++anti-IL-10). The percentage of Th17 cells was detected by intracellular staining for IL-17A by flow cytometery. Data shown are from single experiments representative of three experiments performed. (C) Effect of CD8+CD122+ T cells on IL-17 secretion by CD4+CD25− T cells. Naïve CD4+CD25− T cells from Ly5.1 C57BL/6 mice were stimulated under Th17 conditions, CD8+CD122+/CD8+CD122− T cells either from naïve Ly5.2 wild type C57BL/6 (WT) or from Ly5.2 IL-15 transgenic mice (IL-15 Tg) were cocultured with CD4+CD25− T cells for 4 days at a 1:1 ratio. Supernatants were collected and IL-17 was detected by ELISA. In selected groups, 10 μg/mL of anti-IL-10 was added at the initiation of the incubation. *p < 0.05 compared to effector cells alone group analyzed by Student’s t-test. (D) Effect of CD8+CD122+ T cells on the proliferation of CD4+CD25− T-cell proliferation upon anti-CD3 stimulation. Different ratios of effector cells to potential regulatory cells (CD8+ CD122+ or CD8+ CD122− T cells) were cocultured with naïve CD4+CD25− T cells upon plate bound anti-CD3 stimulation for 72 h, cell proliferation was measured in the final 6 h by 3H-TdR incorporation. (C, D) Data are shown as mean ± SD of three samples from a single experiment representative of three independent experiments performed. *p < 0.05 compared to effector cells alone group (Student’s t-test).
