

Abstract
Historical specimens in museum collections provide opportunities to gain insights into the genomic past. For the Western honey bee, Apis mellifera L., this is particularly important because its populations are currently under threat worldwide and have experienced many changes in management and environment over the last century. Using Swiss Apis mellifera mellifera as a case study, our research provides important insights into the genetic diversity of native honey bees prior to the industrial-scale introductions and trade of non-native stocks during the 20th century—the onset of intensive commercial breeding and the decline of wild honey bees following the arrival of Varroa destructor. We sequenced whole-genomes of 22 honey bees from the Natural History Museum in Bern collected in Switzerland, including the oldest A. mellifera sample ever sequenced. We identify both, a historic and a recent migrant, natural or human-mediated, which corroborates with the population history of honey bees in Switzerland. Contrary to what we expected, we find no evidence for a significant genetic bottleneck in Swiss honey bees, and find that genetic diversity is not only maintained, but even slightly increased, most probably due to modern apicultural practices. Finally, we identify signals of selection between historic and modern honey bee populations associated with genes enriched in functions linked to xenobiotics, suggesting a possible selective pressure from the increasing use and diversity of chemicals used in agriculture and apiculture over the last century.
Keywords: Apis mellifera mellifera, museum genomics, genetic diversity, selection signatures, haplotype phasing, biodiversity
Significance
Little is known about native honey bees’ genetic diversity and structure preagricultural and apicultural revolutions during the 20th century—the beginning of commercial bee breeding and decline of wild honey bees following the arrival an invasive ectoparasite. We find no reduction in genetic diversity of a historic honey bee population compared with its contemporary conspecifics. We further identify genes enriched in functions linked to immunity, and the detoxification of possible agrochemicals. The results do not only reveal novel insights into the honey bee genomic past, but also provide valuable baseline genomic data of native populations aiming at making improved conservation management decisions. In addition, our approach to sequence honey bee museum samples serves as a case study for the sequencing of other precious museum specimens.
Introduction
For the most important pollinator of wild and cultured plants, the Western honey bee (Apis mellifera) (Klein et al. 2007; Gallai et al. 2009; IPBES 2016), much has changed in the last decades. Today, it is under pressure globally from new invasive parasites and emergent pathogens, increased use of pesticides, habitat loss, and climate change (Neumann and Carreck 2010; Potts et al. 2010; Vanengelsdorp and Meixner 2010), culminating in major losses of managed honey bee colonies worldwide (Liu et al. 2016; Maggi et al. 2016; Gray et al. 2019; Morawetz et al. 2019).
One of the primary factors driving colony losses is the ectoparasitic mite, Varroa destructor, and its associated viruses (Guzmán-Novoa et al. 2010; Dainat et al. 2012). In the late 1970s, this parasite, native to Asia, spread throughout Western Europe and North America decimating wild A. mellifera colonies. Such is the scale of the threat that today the majority of honey bees cannot survive without human intervention (Rosenkranz et al. 2010). It is thus generally accepted that feral honey bee colonies nearly became extinct after the arrival of the mite (Moritz et al. 2007; De la Rúa et al. 2009), although there are reports of wild honey bee populations persisting in large woodlands (Seeley 2017; Kohl and Rutschmann 2018).
The widespread colony losses and associated population size decline might have potentially resulted in a genetic bottleneck for the remaining wild European honey bees. Such population collapses can lead to loss of genetic diversity and thereby threaten long-term adaptive potential to future environmental changes (Frankham et al. 2002; Allendorf et al. 2013). Honey bees, due to their haplodiploid mating system and social organization, are particularly sensitive to inbreeding depression (Zayed 2009). Studies have demonstrated that high intracolony diversity decreases pathogen load (Desai and Currie 2015) and enhances productivity (Oldroyd et al. 1992; Mattila and Seeley 2007), survivorship (Tarpy et al. 2013), thermoregulation (Jones et al. 2004), and homeostasis (Oldroyd and Fewell 2007). Moreover, it has also been shown that locally adapted honey bees have higher survival (Büchler et al. 2014; Burnham et al. 2019) and lower pathogen levels (Francis et al. 2014), from which follows that there is a need to conserve the underlying genotypic variation (Frankham et al. 2002).
In the second half of the 20th century, Europe underwent large-scale agricultural intensification associated with drastic land-use changes, triggering a significant decline in insect biodiversity (Robinson and Sutherland 2002; van Lexmond et al. 2015). One of the major drivers of this decline is the increasing use of pesticides (Le Féon et al. 2010; Goulson et al. 2015). The late 20th century also witnessed an intensification of apiculture with beekeepers beginning to apply chemicals inside the colony to control pests and pathogens (Johnson 2015). Chemicals applied within the hive, such as miticides and antibiotics, as well as agrochemicals acquired externally can persist for many years in beeswax and affect honey bee colonies in the long-term (Mullin et al. 2010). In the same time frame, apiculture has further experienced rapid professionalization including migratory beekeeping, increased breeding efforts, and importations of non-native subspecies and selected stock. For instance, throughout large parts of its distributional range the native European M-lineage honey bee subspecies, Apis mellifera mellifera, has been replaced by C-lineage bees, mainly Apis mellifera carnica, Apis mellifera ligustica and Buckfast bees preferred by beekeepers (Pinto et al. 2014; Parejo et al. 2016).
Past and contemporary populations differ by natural and human-mediated factors and circumstances, such as beekeeping practices, prevailing pathogens, or the pesticide regime on crops. Modern honey bee populations rely heavily on human management, and their genetic composition is therefore influenced by commercial trade (Vanengelsdorp and Meixner 2010) and artificial selection (Wragg et al. 2016; Parejo et al. 2017). Moreover, they are much more exposed to the drastic land-use changes and prevailing agricultural practices of recent times. Throughout much of Europe until the 1950s, honey bees were much less intensively managed, more closely reflecting natural conditions with little or no human selection, and mostly kept by swarm beekeeping, and thereby in constant gene flow with the wild population. Gaining a greater understanding of the genetic diversity in the past can inform our understanding of the impact of the agricultural and apicultural revolutions on honey bee populations.
One powerful way to investigate the changes between past and modern populations is by analyzing samples that predate the drastic environmental and human-induced transformations. Museum specimens, therefore, offer an excellent opportunity by providing a window into the past (Lister 2011). Comparing historic and contemporary allelic frequencies is the most direct and powerful way to detect microevolutionary change (Mikheyev et al. 2015). The main caveat of museum samples, however, is the difficulty of obtaining high-quality DNA for molecular genetic analysis (Staats et al. 2013), although improvements in DNA extraction protocols continue to be developed (Tin et al. 2014; Sproul and Maddison 2017). Until recently the majority of studies using museum specimens have been based on PCR-amplification of specific genes or mitochondrial DNA (Habel et al. 2009; La Haye et al. 2012). However, due to DNA degradation, fragments which are shorter than the PCR target region cannot be amplified (Tin et al. 2014). The recent advances in high-throughput sequencing enable us now to overcome the challenges of extracting genomic information from museum specimens, as most methods are designed for short fragmented DNA (Staats et al. 2013; Burrell et al. 2015). In the field of human evolution, protocols for high-throughput sequencing applied to ancient DNA from archaeological sites are well established (reviewed by Slatkin and Racimo 2016). However, fewer efforts have been made in the application to historical museum collections from animals and plants (e.g., sequencing of the mitogenome as in Miller et al. 2008; Hung et al. 2013; Besnard et al. 2016), and only most recently high-density genome-wide analyses of museum specimens have been reported (Mikheyev et al. 2015; Linck et al. 2017; Sánchez Barreiro et al. 2017; Cridland et al. 2018).
To date, for honey bees, there have been two studies published using whole-genome sequence data of museum specimen, both of which concerned the introduced range of A. mellifera in North America. Mikheyev et al.(2015) investigated the genomic changes over a 33-year period of a wild honey bee population in Ithaca following the introduction of V. destructor. The authors found evidence of a mitochondrial bottleneck but with little loss of nuclear genetic diversity and population size. Cridland et al. (2018) documented the temporal genetic changes in Californian populations with northern populations experiencing a shift in genetic ancestry from M- to C-lineage since the 1960s and southern populations undergoing Africanization.
Here, we hypothesize that the drastic changes regarding population decline, agricultural and apicultural intensification during the last decades have had profound effects on the genetic diversity and ancestry of native honey bee populations and left signatures of selection on their genomes. Using the Swiss dark honey bee population as a case study, we sequenced museum specimens dated between 1879 and 1959 that were provided by the Natural History Museum in Bern, Switzerland, to investigate the genomic past of the native A. m. mellifera bees. Native Swiss honey bees have suffered from a severe population size decline in recent decades due, in part, to Varroa mites, as well as introductions and replacements of non-native stocks. Together with whole-genome sequence data from a previous study of contemporary Swiss bees (Parejo et al. 2016), we investigated genetic diversity, mitochondrial DNA haplotypes, admixture, and selection signatures. To our knowledge, this is the first study to whole-genome sequence historic honey bee specimen from their native range.
Materials and Methods
Samples
Museum Samples
Twenty-two Swiss A. m. mellifera museum specimens dated between 1879 and 1959 (61–141 years old) were obtained from the Natural History Museum in Bern, Switzerland (fig. 1). Specimen consisted of dried and pinned worker bees (diploid) stored by the museum but originating from several private collections of Swiss entomologists. Samples have been assigned with a QR-code deposited in the Natural History Museum in Bern (supplementary table S1, Supplementary Material online).
Fig. 1.

Sampling sites of the 22 A. m. mellifera museum specimens. Most samples originate from the region around Bern dating between 1941 and 1959, but some are from mountain areas. The oldest sample is from Luzern (1879), Central Switzerland. The second oldest sample (1884) is from Zermatt, Valais, in the Southern Alps. Map created with Datawrapper (www.datawrapper.de, accessed February 2020).
Modern Samples
Whole-genome sequence data were available from a previous study (Parejo et al. 2016) of which we selected 40 pure Swiss A. m. mellifera drones (haploid). These samples cover a slightly larger geographical range than the available museum bees, but due to breeding activities they are very similar to each other representing the current population. In addition, to investigate overall genetic structure and admixture proportions, 36 honey bees from a different evolutionary lineage widely employed by beekeepers in Switzerland were included in some analyses. These included 24 A. m. carnica and 12 A. m. ligustica drones (supplementary table S1, Supplementary Material online) from Parejo et al. (2016) and Henriques et al. (2018).
DNA Extraction and Sequencing
Genomic DNA was extracted from the hind legs of museum specimen (fig. 1) carefully rinsed with Ringer solution, using a phenol–chloroform–isoamyl alcohol (25:24:1) method (Ausubel 1988). Pair-end (2 × 125 bp) libraries (kit) were prepared following manufacturers protocol using the NEBNext Ultra II kit (New England Biolabs, Inc) and sequenced on the Illumina HiSeq3000 platform with 20 samples per lane.
Mapping, Variant Calling, and Single Nucleotide Polymorphism Sets
Mapping
Raw sequence data from modern and historic samples were processed using Cutadapt v1.8 (Martin 2011) to remove Illumina universal adaptors and keep only reads with minimum lengths of 20 bp and a minimum base quality score of 20. Trimmed reads were then mapped against the dark honey bee reference genome INRA_AMelMel_1.0 (www.ncbi.nlm.nih.gov/assembly/GCA_003314205.1, last accessed September 5, 2020) using bwa mem 0.7.10 (Li and Durbin 2009). PCR duplicates were marked using PICARD 2.18.23 (http://broadinstitute.github.io/picard/, last accessed September 5, 2020). Mapping statistics including depth of coverage and percentage of mapped reads were calculated using samtools 1.7 (Li et al. 2009) and GATK v4.1.0.0 (Mckenna et al. 2010; Van Der Auwera et al. 2013). DamageProfiler (https://damageprofiler.readthedocs.io/en/latest/index.html, last accessed September 5, 2020) was used on museum samples to generate damage profiles of the mapped DNA reads caused by deamination of cytosine over time which leads to misincorporations of G→A at the 5′ and C→T at the 3′ ends (Briggs 2010; Sawyer et al. 2012).
Variant Calling
To increase variant confidence, single nucleotide polymorphism (SNP) calling for the A. m. mellifera (NMUSEUM=22 workers, NMODERN=40 drones) was performed using two different software tools (GATK’s Haplotypecaller and SAMtools mpileup). First, following GATK’s best practices, individual GVCFs were produced using Haplotypecaller with parameters: minimum mapping quality = 20, max alternate alleles = 2, minimum quality score = 20, and sample-ploidy = 2 for museum (diploid workers) and sample-ploidy = 1 for modern samples (haploids drones). Subsequently, GVCFs were combined and genotyped to produce a VCF-file containing raw variants for all A. m. mellifera samples. Variants were filtered according GATK’s hard-filtering recommendation (MQ < 40.0, FS > 60.0, QUAL < 30.0, MQRankSum < −12.5, ReadPosRankSum < −8.0) except for quality by depth (QD), where a stricter filter was applied (QD > 5) after QD distribution was investigated before and after filtering (supplementary figs. S1 and S2, Supplementary Material online). Second, multisample SNP calling was also performed using SAMtools/BCFtools mpileup 1.7 (Li et al. 2009) with parameters mapQuality (q > 30), baseQuality (Q > 20), and filtering low-quality variants (QUAL < 30). Both call sets (GATK and SAMtools) were filtered on depth (minimum 5×, maximum 3*average DP) and to include only biallelic SNPs on chromosomes 1–16. Finally, the variants from both call sets were merged using BCFtools isec to keep only SNPs identified in both sets. Variant calling statistics were calculated with BCFtools stats.
Annotation
No published annotation is available for the dark honey bee reference genome (A. m. mellifera; INRA_AMelMel_1.0). Thus, annotation files (gtf, annotation release 104) from the latest honey bee genome Amel_HAv3.1 (Wallberg et al. 2019) were remapped onto the INRA_AMelMel_1.0 genome using NCBI’s remapping service (www.ncbi.nlm.nih.gov/genome/tools/remap, last accessed September 5, 2020). Finally, a custom database for SnpEff4.3t (Cingolani et al. 2012) as per software instructions was generated to annotate the variants and predict their potential effects excluding intergenic, up- and downstream annotations.
Haplotype Phasing
Phasing genotypes into haplotypes is a fundamental requirement of some analyses, such as that of extended haplotype homozygosity (see below), which seek to exploit linkage disequilibrium (LD) between markers. Statistical phasing can be performed with or without a reference panel, and generally the use of an external reference panel has been shown to increase phasing accuracy (Delaneau et al. 2013). However, using haplotypes from the modern drone (haploid) data set to phase the historic worker (diploid) data set risks potentially creating artifactual museum haplotypes that are modern recombinants of ancestral variation. We therefore tested the impact of phasing both with and without the use of the modern bees as a reference panel on the museum bees.
First, SNPs for all samples were filtered on call rate >0.95 using VCFtools (Danecek et al. 2011) leaving 2,651,904 SNPs and missing SNPs were imputed within SHAPEIT4 (Delaneau et al. 2019). Preliminary analyses masking 5% of the SNPs with 100% call rate revealed that imputation using this approach is highly accurate (>90% accuracy, supplementary fig. S6, Supplementary Material online) while keeping a larger number of SNPs. Subsequently, the data were phased without a reference panel in museum and modern data sets independently, and using the self-imputed modern bees as references we phased the unphased museum data once more. Phasing was performed with SHAPEIT4 (Delaneau et al. 2019) with the sequencing flag, a minimum window size of 0.1 Mb (the minimum permitted by SHAPEIT4) and an effective population (Ne) size of 150,000 which approximates the Ne calculation of Wallberg et al. (2014) for the Northern A. m. mellifera samples they studied. Genetic maps for phasing were generated by lifting over the Amel4.5 reference genome physical positions in the crossover data generated by Liu et al. (2015) to those of INRA_AMelMel_1.0, and used the crossover information to estimate genetic positions for each SNP. The combined phased data sets including either reference or self-phased museum worker bees were filtered on minor allele frequency (MAF > 0.05), each leaving 1,828,439 SNPs for signatures of selection analyses and linkage decay estimation.
Mitochondrial DNA
Variants in the mitochondrial genome of the A. m. mellifera bees were called using SAMtools mpileup 1.7 with the—ploidy 1 option and keeping only SNP variants with high quality (QUAL >30). The resulting 254 SNPs were genotyped in the C-lineage samples using GATK’s Haplotypecaller with mode genotype-given-alleles. C-lineage and A. m. mellifera samples were combined and SNPs with >20% missing calls were removed. This left 205 SNPs to perform Median-Joining network analysis (Bandelt et al. 1999) in PopART (Leigh and Bryant 2015).
Population Structure Analyses
Combining Haploid Drones to Diploid Individuals
Population structure analyses are sensitive when haploid and diploid data sets are analyzed together (Dufresne et al. 2014; Wragg et al. 2016). To get the most informative and unbiased results for population structure analyses, we therefore randomly combined the haploid genotypes of two modern A. m. mellifera drones using a custom script to generate in silico diploids following the procedure in Wragg et al. (2016).
For population structure analyses, the data set with the diploid museum samples and “diploidized” modern samples of A. m. mellifera was filtered and pruned on LD using PLINK1.9 (Chang et al. 2015). We applied –indep-pairwise 50 10 0.1 to filter out variants with a correlation of >0.1 in each window of 50 variants as recommended by Alexander et al. (2009) and kept only SNPs with a 100% call rate. This left 59 K independent SNPs, which were then genotyped in the C-lineage drones using GATK’s Haplotypecaller with mode genotype-given-alleles. Finally, similar to the modern A. m. mellifera samples, the haploid C-lineage drones were randomly combined into diploid individuals using a custom script.
The combined data set for the population structure analyses comprised 59 K SNPs genotyped in 60 samples (22 museum A. m. mellifera, 20 “diploidized” modern A. m. mellifera, 12 “diploidized” A. m. carnica, and 6 “diploidized” A. m. ligustica). This data set was used to estimate the average genome-wide divergence, model-based ancestry, and in principal component analysis (PCA).
Ancestry, PCA, and Population Differentiation
To infer the genetic ancestry of each individual, we performed model-based clustering as implemented in ADMIXTURE (Alexander et al. 2009). We ran the analysis unsupervised with 10,000 iterations for 1–5 hypothetical ancestral (K) clusters. Cross-validation error was estimated for each cluster and used to determine the optimal number of K clusters. We also performed PCA to assess the population structure in the absence of a model (Price et al. 2006). PCA was applied to the pairwise genetic relationships between all individuals (N = 60) according to their identity-by-state values computed in PLINK 1.9 (Chang et al. 2015). Admixture and PCA results were processed and plotted in R (R Development Core Team 2013). Based on these results, a single admixed museum bee was identified, which was subsequently excluded from downstream analyses (population differentiation, genetic diversity, linkage, and selection signatures).
Population differentiation was estimated as mean pairwise FST (Weir and Cockerham 1984) per site as implemented in VCFtools (Danecek et al. 2011). The mean and confidence intervals were calculated from 10 randomly selected bootstrap samples of 10 modern A. m. mellifera, 10 historic A. m. mellifera, and 10 C-lineage bees.
Genetic Diversity
To infer the adaptive potential within the modern and historic A. m. mellifera populations two genetic diversity measures were employed: 1) Expected heterozygosity (HExp) for each individual was calculated using the data set of 59 K unlinked SNPs; and 2) nucleotide diversity (π; Nei 1982), which was calculated from the whole-genome data for each population in window sizes of 10 kb with 5 kb overlap using VCFtools (Danecek et al. 2011). The mean and confidence intervals for HExp and π were calculated with 10 randomly selected samples for each of 10 modern and 10 historic A. m. mellifera.
LD Estimation
LD between each pair of SNPs in the modern and historic populations was calculated using the self- and reference-phased museum bees (N = 21 samples → N = 42 haplotypes) and the haploid modern drones (N = 40) by estimating the Pearson’s squared correlation coefficient (r2) in Plink v1.09 (Chang et al. 2015). Pairwise LD (as r2 values) were calculated between all the pairs of SNPs within each chromosome based on the exact solution of the Hill equation (Hill 1974; Gaunt et al. 2007) and applying a MAF filter of 0.05. The extent of LD decay was estimated based on physical distance between each SNP pair. LD decay curves were calculated as the average r2 within bins of 200 base pairs, up to a distance of 10 kbp and plotted in R.
Selection Signatures Analyses
Genome Scan
Several measures are available to infer signatures of selection, employing a range of test statistics each with its own limits and merits (reviewed in Vitti et al. 2013). Here, we employed cross-population extended haplotype homozygosity (XP-EHH) described by Sabeti et al. (2007). The XP-EHH test statistic is based on extended haplotype length which has been shown to be most suitable to infer recent selection and is especially useful for identifying hard and soft selective sweeps with causative alleles that have not reached fixation (Sabeti et al. 2007; Vitti et al. 2013). The XP-EHH analysis is based on haplotype length and is, thus, sensitive to accurate phasing. Hence, we performed the analysis twice—once comparing the self-phased museum to modern bees, and secondly comparing museum bees phased with the modern bees as a reference panel to the modern bees. The analyses were performed using selscan v1.2.1 (Szpiech and Hernandez 2014) with default MAF and EHH truncation values of 0.05. The obtained XP-EHH scores for each SNP were normalized (Z-transformed) by subtracting genome-wide mean XP-EHH and dividing by the standard deviation (supplementary fig. S4, Supplementary Material online). SNPs with absolute Z-transformed XP-EHH values in the 99th percentile were considered significant. A similar approach has been employed by other studies investigating selection signatures in the honey bee genome (Wallberg et al. 2016; Montero-Mendieta et al. 2019). Finally, genes associated with SNPs annotated with SNPeff as intronic, exonic, 3′UTR, 5′UTR, and splice variants, that were identified in both genome scans (self-phased and reference-phased worker bees) are considered as putative candidates under selection.
Gene Ontology Enrichment Analysis
Gene Ontology (GO) annotations provide a convenient means of grouping genes by their known functions and predicted biological roles, enabling enrichment analyses to be conducted. The online resource DAVID v.6.8 (Database for Annotation, Visualization, and Integrated Discovery; Huang et al. 2007) was accessed in June 2020 to test if the candidate genes identified demonstrated enrichment for any particular function (Huang et al. 2009). We used as a background gene set all honey bee genes associated with at least one SNP in our analyses. Functionally related genes were clustered using the gene functional classification tool set to highest stringency. Enrichment for GO category terms was performed with the functional annotation analysis tool using the GO categories of Biological Process, Cellular Component, Molecular Function, and KEGG pathway. The functional annotation clustering tool was subsequently used to cluster similar GO terms.
Results
Mapping and SNP Calling
In total, 686,376,114 sequencing reads were generated from the 22 museum samples. A summary of alignment statistics of these sequence reads in addition to those of the 76 modern samples is provided in supplementary table S1, and figures S1 and S2, Supplementary Material online. The average mapping rate across the museum samples was 93.7%, with a mean depth of coverage of 13.9×, ranging from 5.55× to 27.39×, in comparison with the modern A. m. mellifera drones with mean 10.3× and range 7.3–21.2. Only 34% of reads for sample KirBE_1941 mapped to the reference genome, possibly indicating contamination, nevertheless, the depth of coverage was 7.8× and the sample retained in downstream analyses. On average for museum and modern samples, respectively, 85% and 92.2% of the genome per sample was callable, having a depth of coverage >4×, whereas the lowest breadth of coverage was observed in BerBE_1947-2 (57.7%). The oldest sample, LuzLU_1879-2, returned a depth and breadth of coverage of 9.02× and 69.6%, respectively.
Analysis of DNA degradation by DamageProfiler (supplementary table S2 and fig. S5, Supplementary Material online) indicated only minor 5′ (2.1% ± 0.6 SD) and 3′ (2.4% ± 0.5 SD) misincorporations compared with studies of ancient DNA (e.g., ∼8%, Peltzer et al. 2018). The misincorporations of two the oldest museum samples dating from 1884 to 1879 were estimated at 3% and 4.5% for G→A at the 5′ end, whereas for the C→T at the 3′ end it was 2.5% and 4.3%, respectively. However, because mismatches at the ends of the sequence reads are soft-clipped by bwa mem during alignment, no additional read filtering or clipping was performed.
Overall, with except for the two oldest samples and BerBE_1947-2 with the lowest breath of coverage, the sequence quality of the museum samples can be considered comparable with those of the modern samples (supplementary tables S1 and S2, Supplementary Material online).
Variant calling was performed using GATK’s Haplotypecaller and SAMtools mpileup, resulting in 4,611,541 and 4,145,606 SNPs, respectively (supplementary table S3, Supplementary Material online). Applying filters to remove low-quality variants and intersecting both variant sets, left 3,252,197 genome-wide SNPs. The average genotyping call rate was 0.94 in the museum samples and 0.97 in the modern bees, with all samples except for three exceeding 90% call rate (supplementary table S3A, figs. S6 and S7, Supplementary Material online). The museum sample with the lowest genotyping rate of 0.78 was BerBE_1947-2, which was also the sample with the lowest mapping rate potentially due to contamination.
Different additional filters were applied for subsequent analyses (supplementary table S3, Supplementary Material online): For estimating nucleotide diversity and for phasing the data set was additionally filtered on call rate 0.95 leaving 2,651,904 SNPs, for linkage and XP-EHH a MAF filter of >0.05 was applied leaving 1,828,439 SNPs, and for PCA, model-based admixture, FST, and HExp the data set was filtered for unlinked SNPs with a call rate of 100% leaving 59,320 SNPs.
Mitochondrial Haplotype Networks
Mitochondrial network analysis revealed evidence of mito-nuclear discordance. The native dark honey bee of Switzerland belongs to the M-lineage, but we found that one individual sampled in Liebefeld in 1959 (LieBE_1959-1) and another sampled in the Swiss Alps in 1958 (LoeVS_1958) possess mitochondrial haplotypes that cluster with C-lineage bees (fig. 2). A phylogenetic analysis of SNPs identified on the complete mitochondrial genome showed that all but two modern and historic A. m. mellifera samples cluster in two M-lineage clades (supplementary fig. S8, Supplementary Material online). The two historic samples that are placed in a distant branch in the phylogenetic analysis are the same samples that cluster within the C-linage of the haplotype network.
Fig. 2.

Median-joining network inferred from 205 mtDNA SNPs and 60 samples (N = 22 museum A. m. mellifera, N = 20 modern A. m. mellifera, N = 12 A. m. carnica, and N = 6 A. m. ligustica). Hypothetical (unsampled or extinct) haplotypes are denoted as filled black circles. The values in brackets indicate base pair differences between haplotypes. M-lineage samples including modern and historic A. m. mellifera are grouped into two clades, with the exception of two museum samples (LieBE_1959-1 and LoeVS_1958) which cluster with C-lineage bees (denoted by the arrows).
Population Structure
Population structure inferred by the model-based ADMIXTURE and PCA each revealed four (sub-) populations representing historic A. m. mellifera, modern A. m. mellifera, A. m. carnica and A. m. ligustica bees (fig. 3). The optimal number of clusters identified from the lowest cross-validation error is K = 2 (supplementary fig. S9, Supplementary Material online), which correspond to the two major evolutionary lineages: M- (A. m. mellifera) and C-lineage (A. m. carnica and A. m. ligustica). One of the museum bees, LieBE_1959-1 shows evidence of genetic admixture with the C-lineage (60.5% M-lineage and 39.5% C-lineage ancestry), as indicated by the dual-color genetic background in the ADMIXTURE plot (fig. 3A) and its intermediate placement along PC1 in the PCA plot (fig. 3B). LieBE_1959-1 is one of two bees identified from the mitochondrial analyses to possess C-lineage mtDNA (fig. 2).
Fig. 3.

Population structure inferred from the LD-pruned 59 K SNPs and 60 samples (N = 22 museum A. m. mellifera, N = 20 “diploidized” modern A. m. mellifera, N = 12 “diploidized” A. m. carnica, and N = 6 “diploidized” A. m. ligustica). (A) Genetic ancestry as calculated with ADMIXTURE for K = 2 to 4 hypothetical ancestral populations. Each color represents one of K clusters. Each individual is represented by a horizontal bar and colored according to the proportion of the genome that was derived from each cluster. The optimal number of clusters identified by cross-validation is K = 2. (B) PCA of genetic distance between individuals. The first principal component (PC1) explains 97% of the variation indicating strong divergence between M- and C-lineage honey bees, whereas PC2 accounts only for 0.2% of the variance.
When estimating population differentiation (FST) using the 59 K SNP data set, the museum bee identified as being admixed was excluded from the analysis. The FST analysis revealed a high divergence between C-lineage bees and the historic and modern A. m. mellifera populations (FST>0.4), and, whereas the divergence between the modern and museum samples was expectedly very low, it was significantly different from 0 based on random subsampling (FST= 0.007, 95% CI 0.004–0.009).
Genetic Diversity
To investigate differences in genetic diversity and population histories between modern and museum A. m. mellifera, we calculated expected heterozygosity (HExp) and nucleotide diversity (π). Heterozygosity differed significantly between both populations (HE(Museum)=0.243, 95% CI 0.241–0.245, HE(Modern)=0.258, 95% CI 0. 257–0.259). The formula of HExp is based on allele frequencies and is therefore not influenced by ploidy, nor the generation of in silico diploids (as we tested in preliminary analyses). Moreover, we also estimated nucleotide diversity which is calculated on haploid sequences (phased genotypes) and, thus, insensitive to ploidy. Similarly to HExp also nucleotide diversity was slightly higher in the modern A. m. mellifera population (π=0.00241, 95% CI 0.00240–0.00243) compared with the historic (π=0.00227, 95% CI 0.00224–0.00230). Both measures of genetic diversity being larger in the modern population suggest enhanced adaptive potential. Observed heterozygosity in the identified admixed museum bee (LieBE_1959-1) was considerably higher (HObs=0.42) than the expected heterozygosity (HExp=0.26), and also higher than for all other A. m. mellifera samples, suggesting the admixture to be recent.
LD Decay
LD decay between SNPs in the modern and historic A. m. mellifera populations as measured using r2 over increasing distances between pairwise SNPs is shown in figure 4. The maximum average LD for SNPs less than 200 bps apart was 1.5 times as high in the modern population (r2=0.43) compared with the historic population (r2∼0.28). LD decays quickly for both populations, but long-range LD was found to be considerably lower for the historic (r2∼0.02) than the modern population (r2∼0.12) potentially reflecting the recent population history of a small, inbred or admixed population. There is a slight, but insignificant tendency for LD to be higher in museum bees phased with the drones as references (fig. 4).
Fig. 4.
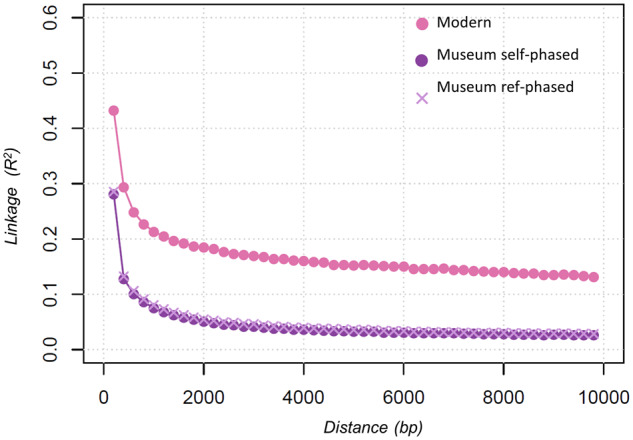
LD between SNPs as measured by r2 (y axis) for increasing distance between SNPs (x axis) for A. m. mellifera modern drones (N = 40) and A. m. mellifera museum bee haplotypes (N = 42 haplotypes) self-phased and phased using the drones as a reference panel.
Selection Signatures between Historic and Modern A. m. mellifera Populations
We investigated the presence of signatures of selection between the historic and modern A. m. mellifera populations using the XP-EHH method (Sabeti et al. 2007) and with two different data sets including either the self-phased or reference-phased museum worker haplotypes. There was an 84% overlap of the SNPs (15,354 SNPs) falling within the 99th percentile in both scans (supplementary fig. S10, Supplementary Material online) which were considered as being associated with putative signatures of selection (fig. 5 and supplementary table S4, Supplementary Material online). In a first screening, we identified an extreme peak on chromosome 11 (supplementary fig. S11, Supplementary Material online), which on further investigation was identified to most likely be a duplication not captured in the reference genome due to 1) the average depth of coverage in the region being ∼1.6 times the chromosome average, and 2) the presence of reads with both alleles (reference and alternate) in the haploid drones. Furthermore, this peak lies within a low-complexity centromere and no gene is annotated within ±15 kb. We have thus excluded it from further analyses. The remaining SNPs are associated with 644 candidate genes (supplementary table S5, Supplementary Material online). Many of the genes identified are uncharacterized loci (29.8%) as the annotation of the honey bee genome is far from complete. Of the 15,354 SNPs, 275 and 13 SNPs were predicted by SNPeff to have MODERATE and HIGH impact, respectively (supplementary table S6, Supplementary Material online). These included mostly nonsynonymous base pair changes, and also splice region variants as well as stop lost/gained variants.
Fig. 5.

Signatures of selection between historic and modern A. m. mellifera from Switzerland. XP-EHH was performed using 42 haplotypes derived from 21 museum samples (diploid) (A) self-phased and (B) reference-phased, and 40 haplotypes derived from modern drones (haploid). XP-EHH scores are plotted along the 16 honey bee chromosomes with negative values indicating selection in the modern population. The dashed lines denote SNPs in the 99th percentile of the absolute XP-EHH scores. This figure excludes the false positive peak on chromosome 11 (4945317-4945798), which can be seen in figure S11, Supplementary Material online. The five highest peaks of each analysis are labeled with their putative genes under selection.
GO analysis is a strategy to identify the most important biological processes of candidate regions identified in whole-genome selection scans. However, the power of these analyses depends on the number and quality of annotated genes available for the focal organism (Yon Rhee et al. 2008). We conducted a GO analysis using the online resource DAVID. Of the 644 candidate genes for selection, 617 were present in the DAVID knowledgebase (v6.8) (supplementary table S5, Supplementary Material online). For the background gene list of 10,848 genes associated with at least one SNP in our analysis, 10,174 genes were present in the DAVID knowledgebase. Functional classification clustered 105 candidate genes into 10 groups (supplementary table S7, Supplementary Material online), of which 3 had an enrichment score >3 (table 1). The most enriched of these, gene group 1 (enrichment score = 10.8) entails genes related to the immunoglobulin superfamily (IgSF), amongst them are two Down syndrome cell adhesion molecules (Dscam) family members (Abscam and Dscam2) and eight homologs of lachesin, another cell-adhesion molecule. The second most enriched group (enrichment score = 3.8) are transmembrane signaling receptors involved in sensory perception of smell, odorant binding, response to stimulus and sensory transduction. The third most enriched group 3 (enrichment score = 3.8), includes five nicotinic acetylcholine receptors (nAChRs) (nAChRa7, nAChRa6, nAChRa4, nAChRa3, and nAChRa1), two ionotropic glutamate receptors (LOC408645, LOC412993) which act as neurotransmitter, as well as Grd, a gamma-aminobutyric acid (GABA) channel. To highlight is also gene group 6 (enrichment score = 2.4; supplementary table S7, Supplementary Material online), which entails five tyrosine-protein kinases. Furthermore, GO analysis revealed that clusters of GO terms of the candidate genes are significantly enriched (enrichment score > 2) for terms related to regulation, membrane, synapses, ion channels, and signaling (supplementary table S8, Supplementary Material online).
Table 1.
Significantly Enriched Gene Groups (Enrichment Score > 3) between Historic and Modern A. m. mellifera as Inferred from the XP-EHH Whole-Genome Scan and Based on the Functional Classification Tool of DAVID v.6.8
| Groups | Gene ID | Gene Name |
|---|---|---|
| Gene group 1 enrichment score: 10.805 | LOC413215 | Lachesin |
| LOC409546 | Lachesin | |
| LOC726655 | Uncharacterized LOC726655 | |
| LOC725803 | Slit homolog 1 protein-like | |
| Abscam | Dscam family member AbsCAM | |
| LOC410662 | Lachesin-like | |
| LOC725091 | Lachesin-like | |
| LOC411176 | Neurotrimin-like | |
| LOC725840 | Lachesin-like | |
| LOC724195 | B-cell receptor CD22 | |
| LOC410563 | Uncharacterized LOC410563 | |
| LOC410888 | Lachesin-like | |
| LOC724847 | Uncharacterized LOC724847 | |
| LOC100577522 | Uncharacterized LOC100577522 | |
| LOC412813 | Neuronal growth regulator 1 | |
| LOC412859 | Hemicentin-2 | |
| LOC410696 | ADAMTS-like protein 3 | |
| LOC725924 | Leucine-rich repeat-containing protein 24 | |
| LOC726017 | Lachesin | |
| LOC409707 | Cell adhesion molecule 4-like | |
| LOC725264 | Uncharacterized LOC725264 | |
| LOC412855 | Down syndrome cell adhesion molecule-like protein Dscam2 | |
| LOC725543 | Chaoptin-like | |
| LOC725870 | Slit homolog 3 protein-like | |
| LOC409701 | Uncharacterized LOC409701 | |
| LOC411158 | Leucine-rich repeat-containing protein 24 | |
| LOC413555 | Lachesin-like | |
| LOC411345 | Neurotrimin | |
| Gene group 2 enrichment score: 3.790 | LOC100577743 | Uncharacterized LOC100577743 |
| Or30 | Odorant receptor 30 | |
| LOC413829 | Diuretic hormone receptor | |
| LOC100578724 | Uncharacterized LOC100578724 | |
| LOC411760 | Metabotropic glutamate receptor 7 | |
| LOC100576984 | Odorant receptor 4-like | |
| LOC102655559 | Uncharacterized LOC102655559 | |
| DopR2 | Dopamine receptor 2 | |
| 5-ht7 | Serotonin receptor 7 | |
| LOC412883 | Allatostatin C receptor | |
| LOC552142 | Latrophilin Cirl-like | |
| Akhr | Adipokinetic hormone receptor | |
| LOC100578662 | Cadherin EGF LAG seven-pass G-type receptor 1-like | |
| LOC724760 | G-protein coupled receptor Mth2 | |
| LOC724853 | Probable G-protein coupled receptor Mth-like 1 | |
| Or57 | Odorant receptor 57 | |
| LOC724237 | Prostaglandin E2 receptor EP3 subtype | |
| LOC102656567 | Uncharacterized LOC102656567 | |
| LOC100578739 | Neuropeptide Y receptor-like | |
| LOC412994 | Octopamine receptor beta-3R | |
| LOC412570 | Tachykinin-like peptides receptor 99D | |
| LOC100577231 | Uncharacterized LOC100577231 | |
| LOC724602 | FMRFamide receptor | |
| LOC100577888 | Uncharacterized LOC100577888 | |
| LOC100576383 | Uncharacterized LOC100576383 | |
| Gene group 3 enrichment score: 3.377 | nAChRa6 | nAChR alpha6 subunit |
| LOC412993 | Glutamate receptor ionotropic, kainate 2-like | |
| nAChRa3 | nAChR alpha3 subunit | |
| nAChRa7 | nAChR alpha7 subunit | |
| LOC408645 | Glutamate receptor, ionotropic, kainate 2 | |
| nAChRa1 | nAChR alpha1 subunit | |
| Grd | GABA-gated ion channel | |
| nAChRa4 | nAChR alpha4 subunit |
Discussion
Honey bees are our most important pollinators but they are currently facing a plethora of threats worldwide. Among these, genetic threats to population viability require special attention for honey bees due to their haplodiploidy and complementary sex determination (Zayed 2009). It is, thus, critical to preserve the diverse genetic resources of locally adapted bees. However, in a world where honey bees are largely managed what, precisely, defines diverse and locally adapted honey bees? Museum specimen collections offer a great opportunity to gain insight into the genomic past of honey bee populations before the advent of modern apicultural and agricultural practices. Here, we elucidate the historic genetic composition and diversity of a native dark bee population, and investigate how environmental and anthropogenic transformations have left signals on their genomes. To this end, we successfully sequenced and examined the whole-genomes of 22 samples dated between 1879 and 1959 provided by the Natural History Museum, Bern, Switzerland.
Mito-Nuclear Discordance in One Museum Sample Dating from 1958
Discordant patterns between nuclear and mitochondrial markers have been found in numerous studies (Toews and Brelsford 2012). Different processes have been proposed to explain such findings, among others these include adaptive introgression of mtDNA, differences in demographic histories, and sex-biased dispersal (Prowell et al. 2004; Walton et al. 2008; Toews and Brelsford 2012; Wragg et al. 2018). In A. mellifera, patterns of mito-nuclear discordance were previously identified in the Italian bees (C-lineage) which held M-lineage haplotypes in their mitochondrial DNA (Franck et al. 2000). Similarly, in the M-lineage, south and west Iberian honey bees (M-lineage) carry A-lineage mitotypes potentially from secondary contact with African subspecies (Miguel et al. 2011). In our study, we identified one museum specimen from 1958 having C-type mtDNA while being of complete M-lineage ancestry in the nuclear genome. This sample has been collected in Lötschental, a valley that lies on the traditional north–south transit route through the Swiss Alps, and is connected with Italy through two major tunnels built at the beginning of the last century (supplementary fig. S12, Supplementary Material online). It is, therefore, possible for a C-lineage colony or queen to reach Lötschental by transhumance or natural dispersion. Either way, the most probable hypothesis for the mito-nuclear discordance would be that of a relict C-lineage mitochondria which, in subsequent generations, was progressively replaced in the nuclear genome by the prevailing native A. m. mellifera genetic background. In the absence of selection, a migrant offspring typically loses 50% of its ancestral genetic background with each successive generation, thus, after six generations less than 2% of the genome remains of introduced ancestry. Assuming a generation time for honey bees between 2 and 3 years (Winston et al. 1981), detecting a migrant lineage background in the nuclear genome becomes difficult after 12–18 years (6 generations). In our case, this means that the C-lineage introduction, natural, or human-mediated, we observed must have occurred much earlier than 1958 in order for its admixture signal to have eroded in the nuclear genome.
Nuclear-Admixed Honey Bee from 1959
Another individual sampled in Liebefeld in 1959 also contained C-lineage mitotype, and was also found to be admixed in the nuclear genome. Higher observed than expected heterozygosity in this sample suggests a recent hybridization. Liebefeld is home of the national Swiss Bee Research Center, which, starting in the late 1950s, maintained testing apiaries to conduct research projects on breeding and selection with different honey bee lineages. This would likely explain the admixed individual found in that area. Anecdotal reports of C-lineage bee importations can be found in the Swiss beekeeping journals much earlier (e.g., H. Schneider, head of breeding, Swiss beekeeping association). Nevertheless, all other samples in this study show no signs of admixture indicating that introductions were not widespread, or given the much higher A. m. mellifera densities, likely never posed a significant threat to the genetic integrity of native bees.
In contrast, recent studies have evidenced strong signs of admixture in Swiss honey bees (Pinto et al. 2014; Parejo et al. 2016). Our finding that none of the museum samples before 1959 displayed signs of admixture, supports the hypothesis that the present day genetic structure is due to human management, and not, for instance, through a natural contact zone given the close geographic proximity to C-lineage bees. It was not until 1965, when the Beekeepers Association of Western Switzerland decided to give preference to the A. m. carnica breed, that large-scale introductions and replacements started, culminating in today’s rather admixed population.
No Evidence of Loss of Genetic Diversity
For honey bees, high intracolony diversity has been shown to be essential to colony health and vitality (Oldroyd et al. 1992; Mattila and Seeley 2007; Tarpy et al. 2013; Desai and Currie 2015). In our study, we expected the modern A. m. mellifera population to carry lower genetic diversity compared with historic populations due to the decline of the number of wild colonies after the arrival of V. destructor and because of increased breeding efforts which typically reduces genetic diversity in managed livestock. Contrary to our expectations, we observed higher genetic diversity in modern bees. Thus, the reduction in census population size has not led to a genetic bottleneck in the current Swiss A. m. mellifera population, which thereby still holds the adaptive potential to face future anthropogenic and environmental changes. Similarly, Mikheyevet al. (2015) found no loss of genetic diversity in a wild honey bee population in a forest in Ithaca, despite a massive reduction in effective population size. Based on its similarity with managed populations in the surrounding area, the authors interpret that the modern wild population has presumably received immigrants that have escaped from managed apiaries. In California, Cridland et al. (2018) attribute the increased diversity in modern populations to the introduction of Africanized bees. Both studies investigated honey bee populations in North America, the introduced range of A. mellifera. Hence, their estimates of genetic diversity only reflect the species’ invasive range and conclusions drawn from them can therefore not readily be extrapolated to the native range harboring inherent subspecies diversity.
In this study, it is not conclusive what the possible reasons are to explain the identified higher diversity estimates in the modern population. First, it is possible that mechanisms such as the extreme polyandrous mating system with its long-distance mating flights (Adams et al. 1977), the haplodiploid sex determination (Wilson 1905), and the high recombination rate (Liu et al. 2015) maintain an intrinsic high level of genetic variation in honey bee populations, as has been suggested elsewhere (Wallberg et al. 2014; Mikheyev et al. 2015). This hypothesis is supported by a recent study on an inbred population of clonal (thelytokous) honey bees, Apis mellifera capensis (Smith et al. 2019). In spite of inbreeding, the authors found substantially high levels of heterozygosity maintained by heterozygous advantage. Second, extrinsic factors such as increased human management can increase diversity in the honey bee (Harpur et al. 2012). Until the last few decades, apiculture in Switzerland was characterized by traditional swarm-beekeeping, and selection for favorable traits predominantly occurred at the beekeeper’s own apiary. As a consequence, the honey bee’s genetic composition was still largely driven by natural forces. Today, the movement of hives and introductions of A. m. mellifera from different regions are likely promoting increased levels of genetic diversity. Moreover, low levels of C-lineage introgression (undetected by model-based Admixture) in the modern population can result in higher diversity levels than in the unadmixed progenitor population (Harpur et al. 2013).
Despite stringent filtering and quality control, there might be some bias in estimating diversity measures from museum specimens for instance due to limited sampling or lower sequence data quality, which potentially leads to underestimating historic diversity. Nevertheless, the fact that we do not find markedly reduced genetic diversity in contemporary native A. m. mellifera compared with their historic ancestors may suggest that loss of genome-wide neutral genetic diversity might not be one of the major drivers for colony losses. This does not exclude, however, that specific locally adapted genetic variants may be lost jeopardizing colony survivability (De la Rúa et al. 2013). In fact, there is a recent paradigm shift in conservation genomics that genome-wide averages of “genetic” diversity might not reflect the actual adaptive potential, and rather the conservation focus should be on “functional” diversity (Hoffmann et al. 2017). Numerous studies identifying quantitative trait loci (QTLs), such as hygienic behavior, in honey bees (Oxley et al. 2010; Tsuruda et al. 2012), highlight the role of additive genetic variance in shaping important phenotypes. It is variation at such fitness-related QTLs that are crucial for future adaptive potential (Zayed 2009). The conservation of the genetic diversity of native subspecies remains important to maintain within-population variation (De la Rúa et al. 2013).
Increased LD in the Modern Population
Genome-wide patterns of LD are affected by population subdivision, changes in population size, drift and admixture (Slatkin 2008). Thus, the analysis of LD decay curves can help to elucidate population history (Slatkin 2008). In our study, the historic population displays a low and quickly falling LD curve reflecting an unstructured and large population. In contrast, we found considerably higher LD in the modern than in the historic population, despite the higher genetic diversity in the former. Increased levels of LD are usually found after a population bottleneck, due to inbreeding, or after admixture of individuals with very different allele frequencies (Slatkin 2008). Although we find no direct evidence of inbreeding as evidenced by the higher diversity measures, the modern population is characterized by a few small-scale conservation areas on the one hand, and a breeding population of commercially selected breeding lines on the other hand. The maintenance of a closed breeding program combined with low levels of admixture from C-lineage bees could explain the contrasting patterns of diversity and LD in the modern population.
Little Difference between Self- and Reference-Based Haplotype Phasing
Phase information is important for understanding phenotypic expression and haplotype diversity (reviewed in Tewhey et al. 2011), and accurate phasing is crucial for analyses based on haplotype length (Delaneau et al. 2019). Statistical phasing can be performed with or without a reference panel. Whole-genome sequence data in contrast to SNP array data and reference-based phasing is generally known to improve accuracy of statistical phasing (Delaneau et al. 2013), and we thought that this was particularly true for the honey bee with its known high LD decay. Surprisingly, we found only negligible differences in LD structure between the self-phased and referenced-phased museum worker bees. Similarly for the XP-EHH genome scan, the results were comparable: Three out of the top five peaks in each analysis were overlapping, and overall most peak signals were shared among the two genome scans, albeit with differences in the signal intensity (fig. 5). Although our data does not allow estimating the switch error rates, a study in Drosophila melanogaster revealed low error rates with increasing numbers of reference haplotypes—particularly when the reference haplotypes are from the same population (Bukowicki et al. 2016).
Selection Signatures Potentially Associated with Immunity and Chemicals in Agriculture and Apiculture
By comparing the contemporary and historic populations using whole-genome sequencing, it is not only possible to investigate population structure and genetic diversity, but also to identify genes under selection—whether this be due to natural or artificial selection pressures. Overall, we find on average that XP-EHH values are negative, indicating selection in the modern population and corroborating the presence of a historic “wild type” population. The genes associated with these signals of selection have multiple important molecular and biological functions. GO enrichment analyses revealed the genes identified to be significantly enriched in functions related to cell membrane, synapses, signaling, and regulation of biological and cellular processes. The most enriched gene group in our GO analysis contains members of the IgSF. IgSF proteins, well-known to precisely recognize and adhere to cells, are involved in a diverse range of functions including cell–cell recognition, muscle structure, cell-surface receptors, and the immune system (Vogel et al. 2003; Watson 2005). Dscam, a well-studied IgSF gene of Drosophila and of which two orthologs are represented in gene group 1, is able to generate large numbers of different molecules by alternative splicing making (Watson 2005; Ng and Kurtz 2020). Dscam is upregulated after infection and expressed in both the fat body and hemocytes of different insect species (Watson 2005), and there is a growing body of evidence that this hypervariable region is an important player in immunity (reviewed in Armitage et al. 2015).
The enrichment found in immune-related genes in our study could be related due to the emergence of novel parasites and pathogens. Most importantly V. destructor and associated viruses could have imposed high selection pressure due to its high mortality, and also the gut parasite Nosema ceranea, relatively recently introduced to Europe (Botías et al. 2012), and/or a bacterial disease, European foulbrood, whose etiological agent is Melissococcus plutonius, and which has caused numerous heavy outbreaks in Switzerland since the 1990s (Roetschi et al. 2008). Although the correlation with these novel pathogens and the enrichment in IgSF genes in this study remain speculative, it is clear that the immune system is a key fitness-related function and is likely to have evolved in Swiss honey bees over time.
One of the enrichment groups comprises tyrosine kinases, which act as on-off switch of other enzymes and are thereby critical for regulatory processes (Lemmon and Schlessinger 2010). In the potato beetle, Leptinotarsa decemlineata, Shi et al. (2016) found that receptor tyrosine kinase genes respond transcriptionally to five different insecticides by a mode-of-action independent way, and conclude that these mechanisms may, in part, be responsible for sublethal effects of insecticides in insects. Moreover, three D. melanogaster orthologs (Drl, Src64b, and Abl) of our identified tyrosine kinases have been found to affect learning and memory (Dura et al. 1995; Moreau-Fauvarque et al. 2002; Akalal et al. 2011), characteristics that are often described as sublethal effects in honey bees exposed to pesticides (Thompson 2003).
The third most enriched gene group is associated with the nervous system and contains ion channels and neurotransmitter genes, that is five nAChRs, a GABA channels and two glutamate receptors. These proteins are targets of several pesticides widely used in agriculture (Johnson 2015): neonicotinoids (e.g., Clothianidin, Imidacloprid, Thiamethoxam) bind to the nAChRs. GABA channels are target sites of organochlorides (e.g., DDT, dieldrin) as well as for Fipronil, a phenylpyrazole, who also targets glutamate receptors. In Switzerland, DDT was banned in 1972 and organochlorides are no longer in use, but were heavily applied in agriculture in the 1950s and 1960s because of their effectiveness, and could therefore potentially exert strong selection pressures. The first generations of neonicotinoids were employed in agriculture in the 1990s, and were until recently the most widely used insecticides in Switzerland and the world (Sgolastra et al. 2020). The EU and Switzerland banned the use of the three most commonly used neonicotinoids in 2018, with partial exceptions (Sgolastra et al. 2020). Neonicotinoids and Fipronil have similar properties causing nervous stimulation at low concentrations but receptor blockage, and paralysis at higher concentrations (Simon-Delso et al. 2015). In honey bees, sublethal doses lead to impaired learning and navigation, higher mortality and susceptibility to disease via impaired immune function and lower fecundity (van Lexmond et al. 2015). Such sublethal effects have been observed in numerous field-realistic studies (reviewed in Desneux et al. 2007; Blacquiere et al. 2012) and the above-mentioned pesticides have been widely used over prolonged periods over the last decades in Switzerland. It is plausible, therefore, that exposure to insecticides could lead to selection pressures in nontarget species, such as that which we have observed comparing modern to historical Swiss honey bees.
However, organochlorides are not the only substance to target GABA channels, thymol has also been shown to interact with GABA receptors in insects (Priestley et al. 2003; Tong and Coats 2010; Waliwitiya et al. 2010). Thymol, a monoterpene, is a major component of the essential thyme oil and is part of the recommended integrated pest management treatment against V. destructor in Switzerland (Imdorf et al. 1999). As thymol is applied in-hive, honey bees are in direct contact with the product, and so this may also exert a selection pressure.
Ultimately, genome scans for signatures of selection cannot directly reveal which selection pressures have led to the identified signatures. Yet, collectively, our findings suggest that the increased use of chemicals in modern agriculture and apiculture has left a legacy on genomes of the A. m. mellifera population under study.
Supplementary Material
Supplementary data are available at Genome Biology and Evolution online.
Supplementary Material
Acknowledgments
We are very grateful to Dr Hannes Baur from the Natural History Museum in Bern for giving us access to the historic museum specimens. DNA extractions were performed at SGIker facilities, the genotyping and sequencing platform of the University of the Basque Country, with the special assistance of Dr Irati Miguel and Dr Fernando Rendo. We thank the two anonymous reviewers whose comments and suggestions helped improve this manuscript. Sequencing was performed at the GeT PlaGe platform in Toulouse, France. M.P. was supported by a Postdoc fellowship awarded by the Swiss National Science Foundation (SNSF) (P2BEP3_178489). D.H. was supported by the project BeeHappy (POCI-01-0145-FEDER-029871) funded by FEDER (Fundo Europeu de Desenvolvimento Regional) through the program COMPETE 2020—POCI (Programa Operacional para a Competividade e Internacionalização), and by Portuguese funds through FCT (Fundação para a Ciência e a Tecnologia).
Author Contributions
Conceived and designed the study, collected data: M.P. Analyzed and interpret the data: M.P. with input from D.W., A.E., D.H. M.P. wrote the manuscript with input from D.W., A.E., D.H., and J.-D.C. All authors approved the final version of the manuscript.
Data deposition: This project has been deposited at the European Nucleotide Archive (http://www.ebi.ac.uk/ena, last accessed September 5, 2020) under the accession PRJEB34590.
Literature Cited
- Adams J, Rothman ED, Kerr WE, Paulino ZL. 1977. Estimation of the number of sex alleles and queen matings from diploid male frequencies in a population of Apis mellifera. Genetics 86:583–596. [DOI] [PMC free article] [PubMed] [Google Scholar]
- Akalal D-BG, Yu D, Davis RL. 2011. The long-term memory trace formed in the Drosophila α/β mushroom body neurons is abolished in long-term memory mutants. J Neurosci. 31(15):5643–5647. [DOI] [PMC free article] [PubMed] [Google Scholar]
- Alexander DH, Novembre J, Lange K. 2009. Fast model-based estimation of ancestry in unrelated individuals. Genome Res. 19(9):1655–1664. [DOI] [PMC free article] [PubMed] [Google Scholar]
- Allendorf FW, Luikart G, Aitken SN. 2013. Conservation and the genetics of populations. 2nd ed. Hoboken: John Wiley & Sons. [Google Scholar]
- Armitage SAO, Peuß R, Kurtz J. 2015. Dscam and pancrustacean immune memory—a review of the evidence. Dev Comp Immunol. 48(2):315–323. [DOI] [PubMed] [Google Scholar]
- Ausubel F. 1988. Current protocols in molecular biology. In: Ausubel M, Brent R, Kingston RE, Moore DD, Seidman JG, Smith JA, Struhl K, editors. Updated Quarterly. New York (NY): Greene Pub. Associates; Wiley-Interscience. p. 1600.
- Auwera GA, et al. 2013. From fastQ data to high-confidence variant calls: the genome analysis toolkit best practices pipeline. Curr Protoc Bioinform. 43(1):11.10.1–11.10.33. [DOI] [PMC free article] [PubMed] [Google Scholar]
- Bandelt H, Forster P, Röhl A. 1999. Median-joining networks for inferring intraspecific phylogenies. Mol Biol Evol. 16:37–48. [DOI] [PubMed] [Google Scholar]
- Besnard G, et al. 2016. Valuing museum specimens: high-throughput DNA sequencing on historical collections of New Guinea crowned pigeons (Goura). Biol J Linn Soc. 117(1):71–82. [Google Scholar]
- Blacquiere T, Smagghe G, Van Gestel CA, Mommaerts V. 2012. Neonicotinoids in bees: a review on concentrations, side-effects and risk assessment. Ecotoxicology 21(4):973–992. [DOI] [PMC free article] [PubMed] [Google Scholar]
- Botías C, et al. 2012. Further evidence of an oriental origin for Nosema ceranae (Microsporidia: Nosematidae). J Invertebr Pathol. 110(1):108–113. [DOI] [PubMed] [Google Scholar]
- Briggs AW. 2010. Removal of deaminated cytosines and detection of in vivo methylation in ancient DNA. Nucleic Acids Res. 38:87. [DOI] [PMC free article] [PubMed] [Google Scholar]
- Büchler R, et al. 2014. The influence of genetic origin and its interaction with environmental effects on the survival of Apis mellifera L. Colon. Eur J Apic Res. 53(2):205–214. [Google Scholar]
- Bukowicki M, Franssen SU, Schlötterer C. 2016. High rates of phasing errors in highly polymorphic species with low levels of linkage disequilibrium. Mol Ecol Resour. 16(4):874–882. [DOI] [PMC free article] [PubMed] [Google Scholar]
- Burnham AJ, McLaughlin F, Burnham PA, Lehman HK. 2019. Local honey bees (Apis mellifera) have lower pathogen loads and higher productivity compared to non-local transplanted bees in North America. J Apic Res. 58(5):694–701. [Google Scholar]
- Burrell AS, Disotell TR, Bergey CM. 2015. The use of museum specimens with high-throughput DNA sequencers. J Hum Evol. 79:35–44. [DOI] [PMC free article] [PubMed] [Google Scholar]
- Chang CC, et al. 2015. Second-generation PLINK: rising to the challenge of larger and richer datasets. GigaScience 4(1):7. [DOI] [PMC free article] [PubMed] [Google Scholar]
- Cingolani P, et al. 2012. A program for annotating and predicting the effects of single nucleotide polymorphisms, SnpEff: SNPs in the genome of Drosophila melanogaster strain w1118; iso-2; iso-3. Fly (Austin) 6(2):80–92. [DOI] [PMC free article] [PubMed] [Google Scholar]
- Cridland JM, Ramirez SR, Dean CA, Sciligo A, Tsutsui ND. 2018. Genome sequencing of museum specimens reveals rapid changes in the genetic composition of honey bees in California. Genome Biol Evol. 10(2):458–472. [DOI] [PMC free article] [PubMed] [Google Scholar]
- Dainat B, Evans JD, Chen YP, Gauthier L, Neumann P. 2012. Dead or alive: deformed wing virus and Varroa destructor reduce the life span of winter honeybees. Appl Environ Microbiol. 78(4):981–987. [DOI] [PMC free article] [PubMed] [Google Scholar]
- Danecek P, et al. 2011. The variant call format and VCFtools. Bioinformatics 27(15):2156–2158. [DOI] [PMC free article] [PubMed] [Google Scholar]
- Delaneau O, Zagury JF, Marchini J. 2013. Improved whole-chromosome phasing for disease and population genetic studies. Nat Methods 10(1):5–6. [DOI] [PubMed] [Google Scholar]
- Delaneau O, Zagury JF, Robinson MR, Marchini JL, Dermitzakis ET. 2019. Accurate, scalable and integrative haplotype estimation. Nat Commun. 10(1):5436. [DOI] [PMC free article] [PubMed] [Google Scholar]
- De la Rúa P, et al. 2013. Conserving genetic diversity in the honeybee: comments on Harpur et al.(2012). Mol Ecol. 22(12):3208–3210. [DOI] [PubMed] [Google Scholar]
- De la Rúa P, Jaffé R, Dall'Olio R, Muñoz I, Serrano J. 2009. Biodiversity, conservation and current threats to European honeybees. Apidologie 40(3):263–284. [Google Scholar]
- Desai SD, Currie RW. 2015. Genetic diversity within honey bee colonies affects pathogen load and relative virus levels in honey bees, Apis mellifera L. Behav Ecol Sociobiol. 69(9):1527–1541. [Google Scholar]
- Desneux N, Decourtye A, Delpuech J-M. 2007. The sublethal effects of pesticides on beneficial arthropods. Annu Rev Entomol. 52(1):81–106. [DOI] [PubMed] [Google Scholar]
- Dufresne F, Stift M, Vergilino R, Mable BK. 2014. Recent progress and challenges in population genetics of polyploid organisms: an overview of current state‐of‐the‐art molecular and statistical tools. Mol Ecol. 23(1):40–69. [DOI] [PubMed] [Google Scholar]
- Dura JM, Taillebourg E, Préat T. 1995. The Drosophila learning and memory gene linotte encodes a putative receptor tyrosine kinase homologous to the human RYK gene product. FEBS Lett. 370(3):250–254. [DOI] [PubMed] [Google Scholar]
- Francis RM, et al. 2014. The genetic origin of honey bee colonies used in the COLOSS genotype-environment interactions experiment: a comparison of methods. J Apic Res. 53(2):188–204. [Google Scholar]
- Franck P, Garnery L, Celebrano G, Solignac M, Cornuet JM. 2000. Hybrid origins of honeybees from Italy (Apis mellifera ligustica) and Sicily (A. m sicula). Mol Ecol. 9(7):907–921. [DOI] [PubMed] [Google Scholar]
- Frankham R, Ballou JD, Briscoe DA. 2002. Introduction to conservation genetics. Cambridge: Cambridge University Press. [Google Scholar]
- Gallai N, Salles J-M, Settele J, Vaissière BE. 2009. Economic valuation of the vulnerability of world agriculture confronted with pollinator decline. Ecol Econ. 68(3):810–821. [Google Scholar]
- Gaunt TR, Rodríguez S, Day IN. 2007. Cubic exact solutions for the estimation of pairwise haplotype frequencies: implications for linkage disequilibrium analyses and a web tool’CubeX’. BMC Bioinformatics 8(1):428. [DOI] [PMC free article] [PubMed] [Google Scholar]
- Goulson D, Nicholls E, Botías C, Rotheray EL. 2015. Bee declines driven by combined stress from parasites, pesticides, and lack of flowers. Science 347(6229):1255957. [DOI] [PubMed] [Google Scholar]
- Gray A, et al. . 2019. Loss rates of honey bee colonies during winter 2017/18 in 36 countries participating in the COLOSS survey, including effects of forage sources. J Apic Res. 58(4):479–485. [Google Scholar]
- Guzmán-Novoa E, et al. 2010. Varroa destructor is the main culprit for the death and reduced populations of overwintered honey bee (Apis mellifera) colonies in Ontario, Canada*. Apidologie 41(4):443–450. [Google Scholar]
- Habel JC, et al. 2009. Unprecedented long-term genetic monomorphism in an endangered relict butterfly species. Conserv Genet. 10(6):1659–1665. [Google Scholar]
- Harpur BA, Minaei S, Kent CF, Zayed A. 2012. Management increases genetic diversity of honey bees via admixture. Mol Ecol. 21(18):4414–4421. [DOI] [PubMed] [Google Scholar]
- Harpur BA, Minaei S, Kent CF, Zayed A. 2013. Admixture increases diversity in managed honey bees: reply to De la Rúa et al.(2013). Mol Ecol. 22(12):3211–3215. [DOI] [PubMed] [Google Scholar]
- Henriques D, et al. 2018. Developing reduced SNP assays from whole-genome sequence data to estimate introgression in an organism with complex genetic patterns, the Iberian honeybee (Apis mellifera iberiensis). Evol Appl. 11(8):1270–1282. [DOI] [PMC free article] [PubMed] [Google Scholar]
- Hill WG. 1974. Estimation of linkage disequilibrium in randomly mating populations. Heredity 33(2):229–239. [DOI] [PubMed] [Google Scholar]
- Hoffmann AA, Sgrò CM, Kristensen TN. 2017. Revisiting adaptive potential, population size, and conservation. Trends Ecol Evol. 32(7):506–517. [DOI] [PubMed] [Google Scholar]
- Huang DW, et al. 2007. DAVID bioinformatics resources: expanded annotation database and novel algorithms to better extract biology from large gene lists. Nucleic Acids Res. 35(Suppl. 2):W169–175. [DOI] [PMC free article] [PubMed] [Google Scholar]
- Huang D W, Sherman B T, Lempicki R A. 2009. Bioinformatics enrichment tools: paths toward the comprehensive functional analysis of large gene lists. Nucleic Acids Res. 37(1):1–13. [DOI] [PMC free article] [PubMed] [Google Scholar]
- Hung C-M, et al. 2013. The de novo assembly of mitochondrial genomes of the extinct passenger pigeon (Ectopistes migratorius) with next generation sequencing. PLoS One 8(2):e56301. [DOI] [PMC free article] [PubMed] [Google Scholar]
- Imdorf A, Bogdanov S, Ochoa RI, Calderone NW. 1999. Use of essential oils for the control of Varroa jacobsoni Oud. in honey bee colonies. Apidologie 30(2–3):209–228. [Google Scholar]
- IPBES. 2016. Summary for policymakers of the assessment report of the Intergovernmental Science-Policy Platform on Biodiversity and Ecosystem Services on pollinators, pollination and food production. Bonn, Germany: Secretariat of the Intergovernmental Science-Policy Platform on Biodiversity and Ecosystem Services.
- Johnson RM. 2015. Honey bee toxicology. Annu Rev Entomol. 60(1):415–434. [DOI] [PubMed] [Google Scholar]
- Jones JC, Myerscough MR, Graham S, Oldroyd BP. 2004. Honey bee nest thermoregulation: diversity promotes stability. Science 305(5682):402–404. [DOI] [PubMed] [Google Scholar]
- Klein A-M, et al. 2007. Importance of pollinators in changing landscapes for world crops. Proc R Soc B 274(1608):303–313. Vol. p [DOI] [PMC free article] [PubMed] [Google Scholar]
- Kohl PL, Rutschmann B. 2018. The neglected bee trees: European beech forests as a home for feral honey bee colonies. PeerJ 6:e4602. [DOI] [PMC free article] [PubMed] [Google Scholar]
- La Haye MJJ, Neumann K, Koelewijn HP. 2012. Strong decline of gene diversity in local populations of the highly endangered Common hamster (Cricetus cricetus) in the western part of its European range. Conserv Genet. 13(2):311–322. [Google Scholar]
- Le Féon V, et al. 2010. Intensification of agriculture, landscape composition and wild bee communities: a large scale study in four European countries. Agric Ecosyst Environ. 137(1–2):143–150 [Google Scholar]
- Leigh JW, Bryant D. 2015. PopART: full-feature software for haplotype network construction. Methods Ecol Evol. 6(9):1110–1116. [Google Scholar]
- Lemmon MA, Schlessinger J. 2010. Cell signaling by receptor tyrosine kinases. Cell 141(7):1117–1134. [DOI] [PMC free article] [PubMed] [Google Scholar]
- Li H, et al. 2009. The sequence alignment/map format and SAMtools. Bioinformatics 25(16):2078–2079. [DOI] [PMC free article] [PubMed] [Google Scholar]
- Li H, Durbin R. 2009. Fast and accurate short read alignment with Burrows–Wheeler transform. Bioinformatics 25(14):1754–1760. [DOI] [PMC free article] [PubMed] [Google Scholar]
- Linck EB, Hanna ZR, Sellas A, Dumbacher JP. 2017. Evaluating hybridization capture with RAD probes as a tool for museum genomics with historical bird specimens. Ecol Evol. 7(13):4755–4767. [DOI] [PMC free article] [PubMed] [Google Scholar]
- Lister AM. 2011. Natural history collections as sources of long-term datasets. Trends Ecol Evol. 26(4):153–154. [DOI] [PubMed] [Google Scholar]
- Liu H, et al. 2015. Causes and consequences of crossing-over evidenced via a high-resolution recombinational landscape of the honey bee. Genome Biol. 16(1):15. [DOI] [PMC free article] [PubMed] [Google Scholar]
- Liu Z, et al. 2016. Survey results of honey bee (Apis mellifera) colony losses in China (2010–2013). J Apic Res. 55(1):29–37. [Google Scholar]
- Maggi M, et al. 2016. Honeybee health in South America. Apidologie 47(6):835–854. [Google Scholar]
- Martin M. 2011. Cutadapt removes adapter sequences from high-throughput sequencing reads. EMBnet J. 17(1):10–12. [Google Scholar]
- Mattila HR, Seeley TD. 2007. Genetic diversity in honey bee colonies enhances productivity and fitness. Science 317(5836):362–364. [DOI] [PubMed] [Google Scholar]
- Mckenna A, et al. 2010. The genome analysis toolkit: a MapReduce framework for analyzing next-generation DNA sequencing data. Genome Res. 20(9):1297–1303. [DOI] [PMC free article] [PubMed] [Google Scholar]
- Miguel I, et al. 2011. Both geometric morphometric and microsatellite data consistently support the differentiation of the Apis mellifera M evolutionary branch. Apidologie 42(2):150–161. [Google Scholar]
- Mikheyev AS, Tin MM, Arora J, Seeley TD. 2015. Museum samples reveal rapid evolution by wild honey bees exposed to a novel parasite. Nat Commun. 6:7991. [DOI] [PMC free article] [PubMed] [Google Scholar]
- Miller W, et al. 2008. The mitochondrial genome sequence of the Tasmanian tiger (Thylacinus cynocephalus). Genome Res. 19(2):213–220. [DOI] [PMC free article] [PubMed] [Google Scholar]
- Montero-Mendieta S, et al. 2019. The genomic basis of adaptation to high-altitude habitats in the eastern honey bee (Apis cerana). Mol Ecol. 28(4):746–760. [DOI] [PubMed] [Google Scholar]
- Morawetz L, et al. 2019. Health status of honey bee colonies (Apis mellifera) and disease-related risk factors for colony losses in Austria. PLoS One 14(7):e0219293. [DOI] [PMC free article] [PubMed] [Google Scholar]
- Moreau-Fauvarque C, Taillebourg E, Préat T, Dura J-M. 2002. Mutation of linotte causes behavioral defects independently of pigeon in Drosophila. NeuroReport 13(17):2309–2312. [DOI] [PubMed] [Google Scholar]
- Moritz RF, Kraus FB, Kryger P, Crewe RM. 2007. The size of wild honeybee populations (Apis mellifera) and its implications for the conservation of honeybees. J Insect Conserv. 11(4):391–397. [Google Scholar]
- Mullin CA, et al. 2010. High levels of miticides and agrochemicals in North American apiaries: implications for honey bee health. PLoS One 5(3):e9754. [DOI] [PMC free article] [PubMed] [Google Scholar]
- Nei M. 1982. Evolution of human races at the gene level. Hum Genet A 167–181. [PubMed] [Google Scholar]
- Neumann P, Carreck NL. 2010. Honey bee colony losses. J Apic Res. 49(1):1–6. [Google Scholar]
- Ng TH, Kurtz J. 2020. Dscam in immunity: a question of diversity in insects and crustaceans. Dev Comp Immunol. 105:103539. [DOI] [PubMed] [Google Scholar]
- Oldroyd BP, Fewell J. 2007. Genetic diversity promotes homeostasis in insect colonies. Trends Ecol Evol. 22(8):408–413. [DOI] [PubMed] [Google Scholar]
- Oldroyd BP, Rinderer T, Harbo J, Buco S. 1992. Effects of intracolonial genetic diversity on honey bee (Hymenoptera: Apidae) colony performance. Ann Entomol Soc Am. 85(3):335–343. [Google Scholar]
- Oxley PR, Spivak M, Oldroyd BP. 2010. Six quantitative trait loci influence task thresholds for hygienic behaviour in honeybees (Apis mellifera). Mol Ecol. 19(7):1452–1461. [DOI] [PubMed] [Google Scholar]
- Parejo M, et al. 2016. Using whole-genome sequence information to foster conservation efforts for the European Dark Honey Bee, Apis mellifera mellifera. Front Ecol Evol. 4:140. doi:10.3389/fevo.2016.00140. [Google Scholar]
- Parejo M, Wragg D, Henriques D, Vignal A, Neuditschko M. 2017. Genome-wide scans between two honeybee populations reveal putative signatures of human-mediated selection. Anim Genet. 48(6):704–707. [DOI] [PMC free article] [PubMed] [Google Scholar]
- Peltzer A, et al. 2018. Inferring genetic origins and phenotypic traits of George Bähr, the architect of the Dresden Frauenkirche. Sci Rep. 8(1). doi: 10.1038/s41598-018-20180-z [DOI] [PMC free article] [PubMed] [Google Scholar]
- Pinto MA, et al. 2014. Genetic integrity of the Dark European honey bee (Apis mellifera mellifera) from protected populations: a genome-wide assessment using SNPs and mtDNA sequence data. J Apic Res. 53(2):269–278. [Google Scholar]
- Potts SG, et al. 2010. Global pollinator declines: trends, impacts and drivers. Trends Ecol Evol. 25(6):345–353. [DOI] [PubMed] [Google Scholar]
- Price AL, et al. 2006. Principal components analysis corrects for stratification in genome-wide association studies. Nat Genet. 38(8):904–909. [DOI] [PubMed] [Google Scholar]
- Priestley CM, Williamson EM, Wafford KA, Sattelle DB. 2003. Thymol, a constituent of thyme essential oil, is a positive allosteric modulator of human GABAA receptors and a homo‐oligomeric GABA receptor from Drosophila melanogaster. Br J Pharmacol. 140(8):1363–1372. [DOI] [PMC free article] [PubMed] [Google Scholar]
- Prowell DP, McMichael M, Silvain J-F. 2004. Multilocus genetic analysis of host use, introgression, and speciation in host strains of fall armyworm (Lepidoptera: Noctuidae). Ann Entomol Soc Am. 97(5):1034–1044. [Google Scholar]
- R Development Core Team. 2013. R: a language and environment for statistical computing. Vienna, Austria: R Foundation for Statistical Computing.
- Robinson RA, Sutherland WJ. 2002. Post-war changes in arable farming and biodiversity in Great Britain. J Appl Ecol. 39(1):157–176. [Google Scholar]
- Roetschi A, Berthoud H, Kuhn R, Imdorf A. 2008. Infection rate based on quantitative real-time PCR of Melissococcus plutonius, the causal agent of European foulbrood, in honeybee colonies before and after apiary sanitation. Apidologie 39(3):362–371. [Google Scholar]
- Rosenkranz P, Aumeier P, Ziegelmann B. 2010. Biology and control of Varroa destructor. J Invertebr Pathol. 103:S96–119. [DOI] [PubMed] [Google Scholar]
- Sabeti PC, et al. 2007. Genome-wide detection and characterization of positive selection in human populations. Nature 449(7164):913–918. [DOI] [PMC free article] [PubMed] [Google Scholar]
- Sánchez Barreiro F, et al. 2017. Characterizing restriction enzyme-associated loci in historic ragweed (Ambrosia artemisiifolia) voucher specimens using custom-designed RNA probes. Mol Ecol Resour. 17(2):209–220. [DOI] [PubMed] [Google Scholar]
- Sawyer S, Krause J, Guschanski K, Savolainen V, Pääbo S. 2012. Temporal patterns of nucleotide misincorporations and DNA fragmentation in ancient DNA. PLoS One 7(3):e34131. [DOI] [PMC free article] [PubMed] [Google Scholar]
- Seeley TD. 2017. Life-history traits of wild honey bee colonies living in forests around Ithaca, NY, USA. Apidologie 48(6):743–754. [Google Scholar]
- Sgolastra F, et al. 2020. Bees and pesticide regulation: lessons from the neonicotinoid experience. Biol Conserv. 241:108356. [Google Scholar]
- Shi JF, Zhu TT, Guo WC, Li GQ. 2016. Receptor tyrosine kinase genes respond transcriptionally to sublethal doses of five insecticides by a mode-of-action independent way in Leptinotarsa decemlineata (Say). J Asia-Pac Entomol. 19(4):1103–1110. [Google Scholar]
- Simon-Delso N, et al. 2015. Systemic insecticides (neonicotinoids and fipronil): trends, uses, mode of action and metabolites. Environ Sci Pollut Res. 22(1):5–34. [DOI] [PMC free article] [PubMed] [Google Scholar]
- Slatkin M. 2008. Linkage disequilibrium—understanding the evolutionary past and mapping the medical future. Nat Rev Genet. 9(6):477–485. [DOI] [PMC free article] [PubMed] [Google Scholar]
- Slatkin M, Racimo F. 2016. Ancient DNA and human history. Proc Natl Acad Sci USA. 113(23):6380–6387. [DOI] [PMC free article] [PubMed] [Google Scholar]
- Smith NM, et al. 2019. Strikingly high levels of heterozygosity despite 20 years of inbreeding in a clonal honey bee. J Evol Biol. 32(2):144–152. [DOI] [PubMed] [Google Scholar]
- Sproul JS, Maddison DR. 2017. Sequencing historical specimens: successful preparation of small specimens with low amounts of degraded DNA. Mol Ecol Resour. 17(6):1183–1201. [DOI] [PubMed] [Google Scholar]
- Staats M, et al. 2013. Genomic treasure troves: complete genome sequencing of herbarium and insect museum specimens. PLoS One 8(7):e69189. [DOI] [PMC free article] [PubMed] [Google Scholar]
- Szpiech ZA, Hernandez RD. 2014. selscan: an efficient multithreaded program to perform EHH-based scans for positive selection. Mol Biol Evol. 31(10):2824–2827. [DOI] [PMC free article] [PubMed] [Google Scholar]
- Tarpy DR, vanEngelsdorp D, Pettis JS. 2013. Genetic diversity affects colony survivorship in commercial honey bee colonies. Naturwissenschaften 100(8):723–728. [DOI] [PubMed] [Google Scholar]
- Tewhey R, Bansal V, Torkamani A, Topol EJ, Schork NJ. 2011. The importance of phase information for human genomics. Nat Rev Genet. 12(3):215–223. [DOI] [PMC free article] [PubMed] [Google Scholar]
- Thompson HM. 2003. Behavioural effects of pesticides in bees—their potential for use in risk assessment. Ecotoxicology 12(1/4):317–330. [DOI] [PubMed] [Google Scholar]
- Tin MM-Y, Economo EP, Mikheyev AS. 2014. Sequencing degraded DNA from non-destructively sampled museum specimens for RAD-tagging and low-coverage shotgun phylogenetics. PLoS One 9(5):e96793. [DOI] [PMC free article] [PubMed] [Google Scholar]
- Toews DPL, Brelsford A. 2012. The biogeography of mitochondrial and nuclear discordance in animals. Mol Ecol. 21(16):3907–3930. [DOI] [PubMed] [Google Scholar]
- Tong F, Coats JR. 2010. Effects of monoterpenoid insecticides on [3H]-TBOB binding in house fly GABA receptor and 36Cl− uptake in American cockroach ventral nerve cord. Pestic Biochem Physiol. 98(3):317–324. [Google Scholar]
- Tsuruda JM, Harris JW, Bourgeois L, Danka RG, Hunt GJ. 2012. High-resolution linkage analyses to identify genes that influence Varroa sensitive hygiene behavior in honey bees. PLoS One 7(11):e48276. [DOI] [PMC free article] [PubMed] [Google Scholar]
- Vanengelsdorp D, Meixner MD. 2010. A historical review of managed honey bee populations in Europe and the United States and the factors that may affect them. J Invertebr Pathol. 103:80–95. [DOI] [PubMed] [Google Scholar]
- van Lexmond MB, Bonmatin J-M, Goulson D, Noome DA. 2015. Worldwide integrated assessment on systemic pesticides. Environ Sci Pollut Res. 22(1):1–4. [DOI] [PMC free article] [PubMed] [Google Scholar]
- Vitti JJ, Grossman SR, Sabeti PC. 2013. Detecting natural selection in genomic data. Annu Rev Genet. 47(1):97–120. [DOI] [PubMed] [Google Scholar]
- Vogel C, Teichmann SA, Chothia C. 2003. The immunoglobulin superfamily in Drosophila melanogaster and Caenorhabditis elegans and the evolution of complexity. Development 130(25):6317–6328. [DOI] [PubMed] [Google Scholar]
- Waliwitiya R, Belton P, Nicholson RA, Lowenberger CA. 2010. Effects of the essential oil constituent thymol and other neuroactive chemicals on flight motor activity and wing beat frequency in the blowfly Phaenicia sericata. Pest Manag Sci. 66(3):277–289. [DOI] [PubMed] [Google Scholar]
- Wallberg A, et al. . 2014. A worldwide survey of genome sequence variation provides insight into the evolutionary history of the honeybee Apis mellifera. Nat Genet. 46(10):1081–1088. [DOI] [PubMed] [Google Scholar]
- Wallberg A, et al. 2019. A hybrid de novo genome assembly of the honeybee, Apis mellifera, with chromosome-length scaffolds. BMC Genomics 20(1):275. [DOI] [PMC free article] [PubMed] [Google Scholar]
- Wallberg A, Pirk CW, Allsopp MH, Webster MT. 2016. Identification of multiple loci associated with social parasitism in honeybees. PLoS Genet. 12(6):e1006097. [DOI] [PMC free article] [PubMed] [Google Scholar]
- Walton C, et al. 2008. Genetic population structure and introgression in Anopheles dirus mosquitoes in South‐east Asia. Mol Ecol. 10(3):569–580. [DOI] [PubMed] [Google Scholar]
- Watson FL. 2005. Extensive diversity of Ig-superfamily proteins in the immune system of insects. Science 309(5742):1874–1878. [DOI] [PubMed] [Google Scholar]
- Weir BS, Cockerham CC. 1984. Estimating F-statistics for the analysis of population structure. Evolution 38(6):1358–1370. [DOI] [PubMed] [Google Scholar]
- Wilson EB. 1905. The chromosomes in relation to the determination of sex in insects. Science 22(564):500–502. [DOI] [PubMed] [Google Scholar]
- Winston ML, Dropkin JA, Taylor OR. 1981. Demography and life history characteristics of two honey bee races (Apis mellifera). Oecologia 48(3):407–413. [DOI] [PubMed] [Google Scholar]
- Wragg D, et al. 2016. Whole-genome resequencing of honeybee drones to detect genomic selection in a population managed for royal jelly. Sci Rep. 6:1–13. [DOI] [PMC free article] [PubMed] [Google Scholar]
- Wragg D, et al. 2018. Autosomal and mitochondrial adaptation following admixture: a case study on the honeybees of Reunion Island. Genome Biol Evol. 10(1):220–238. [DOI] [PMC free article] [PubMed] [Google Scholar]
- Yon Rhee S, Wood V, Dolinski K, Draghici S. 2008. Use and misuse of the gene ontology annotations. Nat Rev Genet. 9(7):509–515. [DOI] [PubMed] [Google Scholar]
- Zayed A. 2009. Bee genetics and conservation. Apidologie 40(3):237–262. [Google Scholar]
Associated Data
This section collects any data citations, data availability statements, or supplementary materials included in this article.