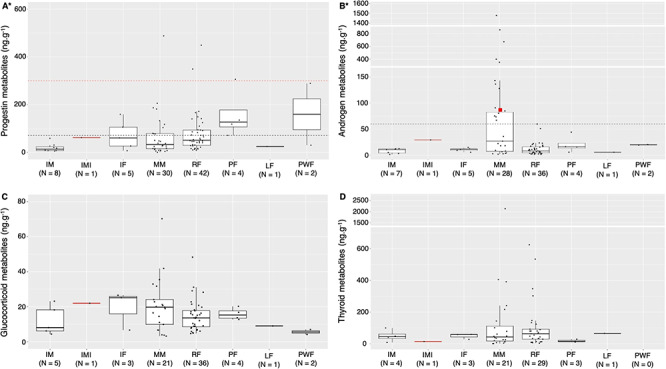
Figure 2.

Variation in progestin (A), androgen (B), glucocorticoid (C) and thyroid (D) metabolite concentrations (ng.g-1, dried mass) by demographic units of gray whale fecal samples collected from May to October of 2016–2018 along the Oregon coast, USA. Each boxplot shows the interquartile range as the white box that encloses 25–75% of the data, the median as the horizontal black line, and the whiskers are the vertical black lines that extend from 5–95% of the data. Each black dot represents one data point used in the boxplot. Asterisks indicate the significance of demographic units on the respective hormone metabolite in the linear mixed models. X-axis groups: IM - immature male; IMI - immature male (injured whale, ID: ErPNW-223); IF - immature female; MM - mature male; RF - resting female; PF - pregnant female; LF - lactating female; PWF - postweaning female. The solid red line represents a case study of an injured immature male (whale ID: ErPNW-223) whose fecal sample was collected within 24 hours of a propeller/vessel strike injury and may reflect a typical endocrine profile of physiologically stressed individuals. (A) The dashed black line designates a putative threshold of 70.78 ng.g-1 for pregnancy in gray whales and the dashed red line designates a more conservative putative threshold of 300 ng.g-1 for pregnancy. (B) The white bars indicate breaks in the y-axis. The dashed black line designates a putative threshold of 60 ng.g-1 for maturity in male gray whales. The red square represents another case study of a mature male (whale ID: ErPNW-80) whose fecal sample was collected during a competitive behavior with another male and may reflect a typical endocrine profile of adult breeding males. (D) The white bar indicates a break in the y axis.
