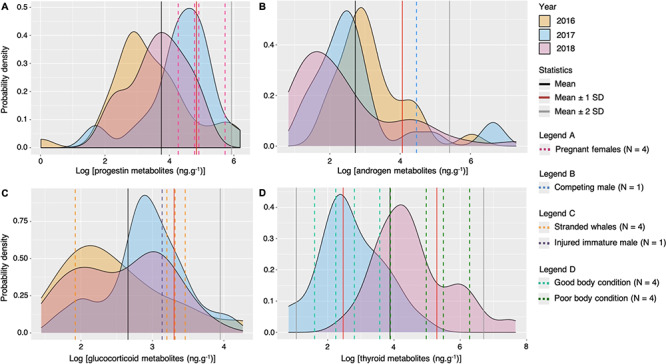
Figure 4.

Probability density plots of gray whale log fecal hormone metabolite (ng.g-1, dried mass) variability by years collected from May to October of 2016–2018 along the Oregon coast, USA. Fecal thyroid metabolite analysis was not performed in 2016. Statistics (mean, mean ± 1 standard deviation, and mean ± 2 standard deviations of all values) are indicated in solid lines. The statistics mean – 1 standard deviation and mean – 2 standard deviations were only performed in the thyroid metabolite analysis. Dashed lines indicate individuals of ‘known state’ and vary according to the hormone metabolites: (A) log progestin metabolite levels with documented pregnant females over the study period identified, (B) log androgen metabolite levels with a mature male in a competing behavior (whale ErPNW-80) identified, (C) log glucocorticoid metabolite levels with four stranded gray whales (Table 1) and an immature male injured within 24 hours of fecal sample collection (whale ErPNW-223, Appendix C - S1, Fig. 3.S3) identified, and (D) log thyroid metabolite levels with whales of documented good and poor body condition (based on Lemos et al. 2020) identified. Note logarithmic scale of x-axes.
