
Figure 5.
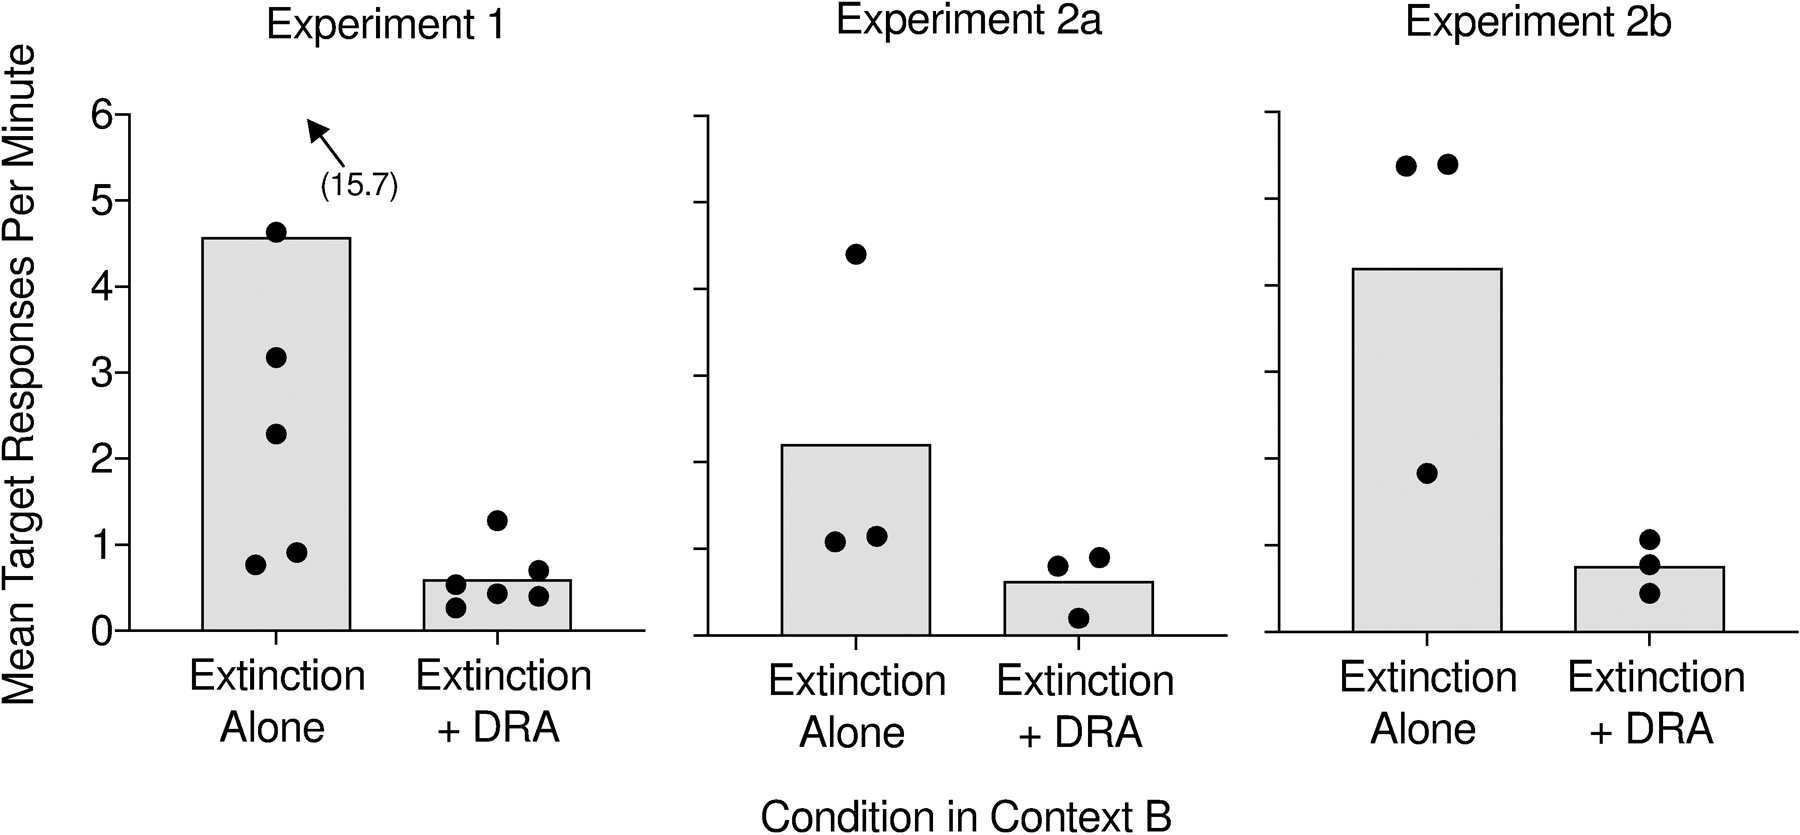
Bars depict mean rates of target responding across participants during Context B in Experiments 1, 2a, and 2b. The data points represent mean response rates for each participant.
Official websites use .gov
A
.gov website belongs to an official
government organization in the United States.
Secure .gov websites use HTTPS
A lock (
) or https:// means you've safely
connected to the .gov website. Share sensitive
information only on official, secure websites.
Bars depict mean rates of target responding across participants during Context B in Experiments 1, 2a, and 2b. The data points represent mean response rates for each participant.