Figure 8.

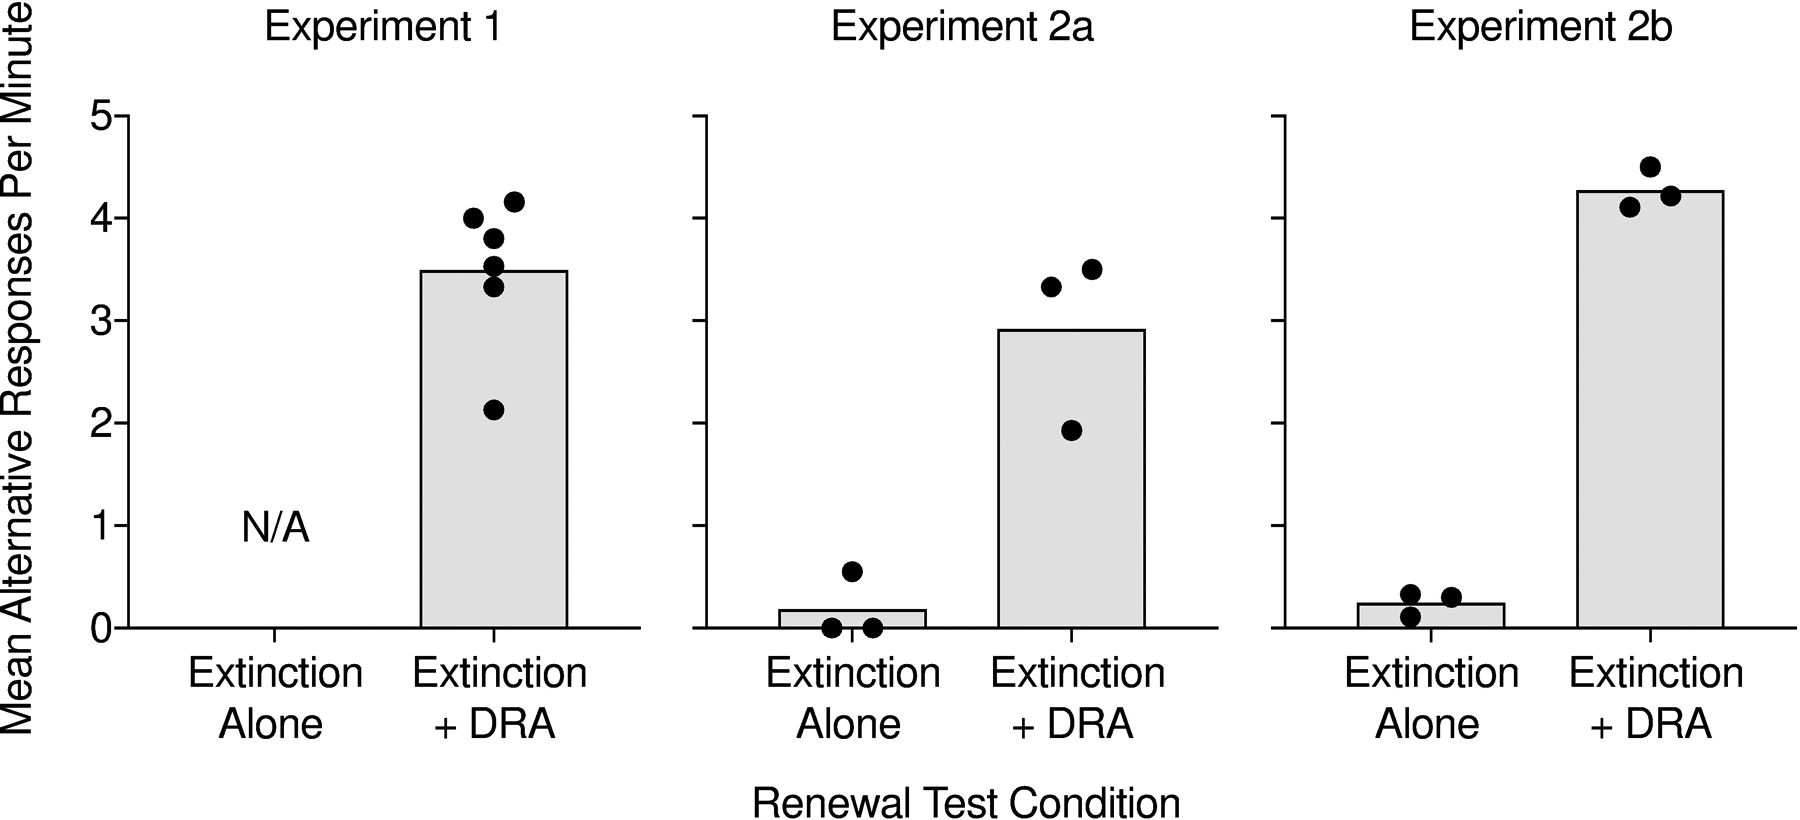
Bars depict mean rates of alternative responding across participants during the renewal tests in Experiments 1, 2a, and 2b. The data points represent mean response rates for each participant.

Bars depict mean rates of alternative responding across participants during the renewal tests in Experiments 1, 2a, and 2b. The data points represent mean response rates for each participant.