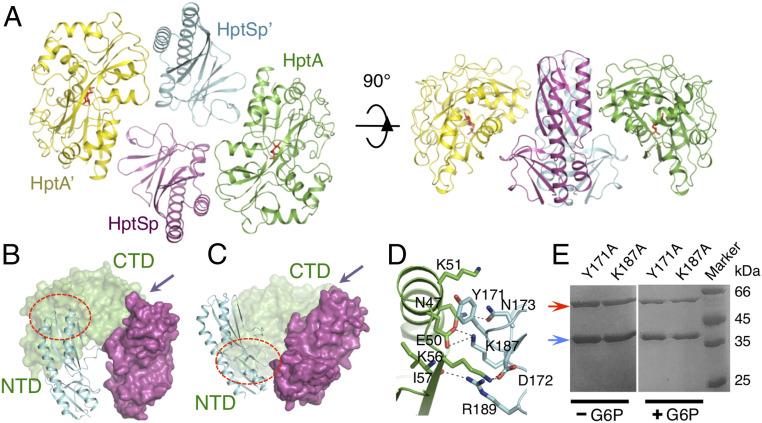
Fig. 4.
Structure of the G6P-bound HptA–HptSp complex. (A) Overall structure of the G6P-bound HptA–HptSp complex. The HptA’ and HptA protomers are shown in yellow and green, respectively. The HptSp’ and HptSp protomers are shown in cyan and magenta, respectively. G6P is shown as red sticks. (B) Interface-B in the apo structure. HptA’ is omitted for clarity. The red circle and arrow indicate the position of Interface-B and Interface-A, respectively. (C) The Interface-C in the G6P bound HptA-HptSp structure. One HptA molecule is omitted for clarity. The red circle and arrow indicate the position of Interface-C and Interface-A, respectively. (D) The contact details of the Interface-C. Residues making interactions are highlighted as sticks. Residues from HptA and HptSp are colored green and cyan, respectively. (E) Pull-down assay of the Interface-C mutants. The red arrow indicates the MBP-HptSp mutant, and the blue arrow indicates WT HptA.

