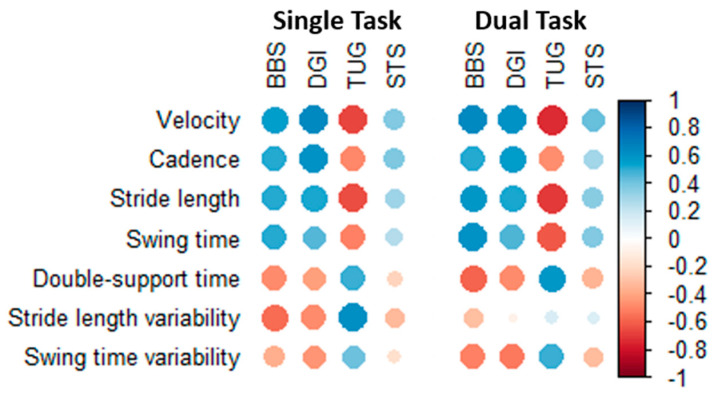
Figure 1.
Correlation between GAITRite parameters and functional balance tests in all patients. Blue represents positive correlations, and red represent negative correlations. Color saturation and dot sizes represent correlation strength. Abbreviations: BBS, Bergs Balance Scale; DGI, Dynamic Gait Index; TUG, Timed Up and Go; STS, Sit To Stand test.

