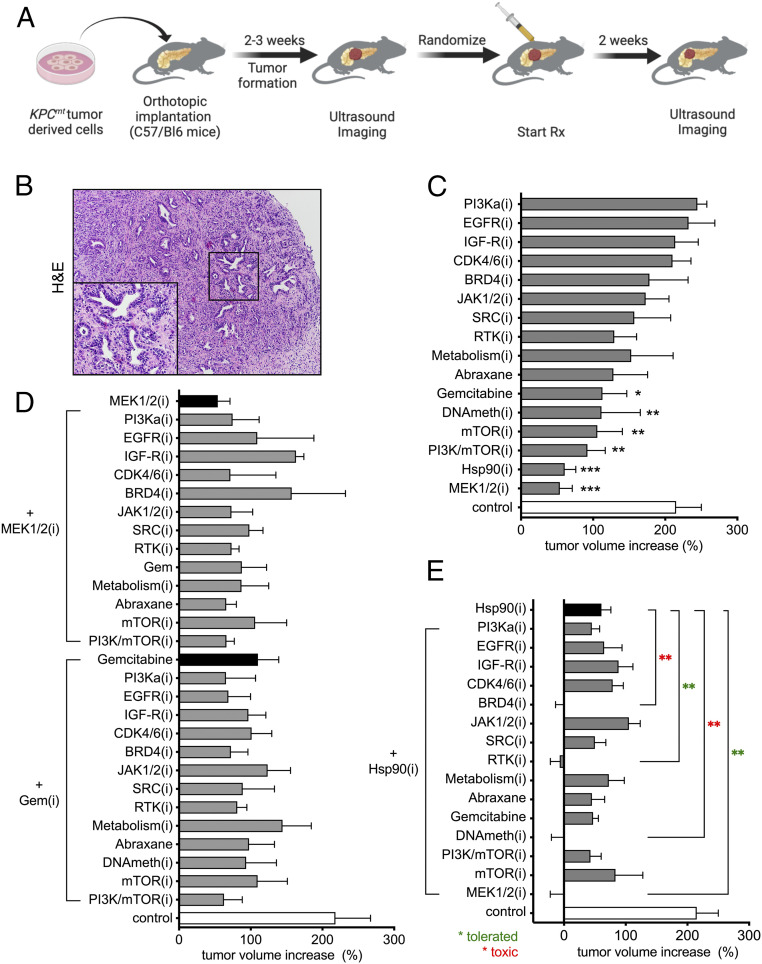
Fig. 1.
In vivo drug screen identifies effective combinatorial therapeutic strategies for PDAC. (A) Schematic representation of in vivo drug screen design using syngeneic orthotopic KPC allografts. Two-week treatment was initiated when tumors were detected by HRUSI, at a time point when tumors were of 100–200 mm3. (B) Hematoxylin and eosin staining of syngeneic PDAC tumors (magnification, 50×; Inset, 200×). (C) A waterfall representation of the average response of PDAC orthotopic transplants following a 2-wk treatment with the indicated monotherapies. Note that none of the drugs caused tumor regression (mean ± SEM; n = 4 per group; *P < 0.05, **P < 0.01; one-way ANOVA). (D) A waterfall representation of the average response of PDAC orthotopic transplants following a 2-wk treatment with GEM or the MEK1/2(i) trametinib, combined with 13 indicated therapies. Note that none of the drug combinations was significantly more effective than GEM or MEK1/2 (i) alone. (n = 4 per group; one-way ANOVA). (E) A waterfall representation of the average response of PDAC orthotopic transplants following 2 wk of treatment with HSP90(i) when combined with 15 indicated therapies. Note that four drug combinations showed enhanced efficacy and produced tumor regression. Among effective drug combinations, HSP90(i)+MEK1/2(i) and HSP90(i)+RTK(i) were well-tolerated (green asterisk) while HSP90(i)+DNAMeth(i) and HSP90(i)+BRD4(i) caused additive toxicity (see text, red asterisk) (mean ± SEM; n = 4 per group; **P < 0.01; one-way ANOVA).

