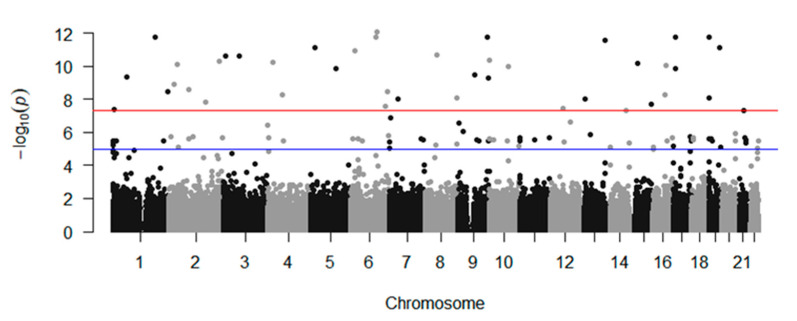
Figure 1.
Manhattan plot for genome wide association study (GWAS) data from the Korean female population, showing −log10 (p-values) from GWAS and imputation analysis plotted against the chromosome position. Each color represents a different chromosome. The lower line indicates the suggested association threshold (p = 1.0 × 10⁻⁵) while the upper line indicates the genome-wide significance threshold (p = 5.0 × 10⁻⁸).

