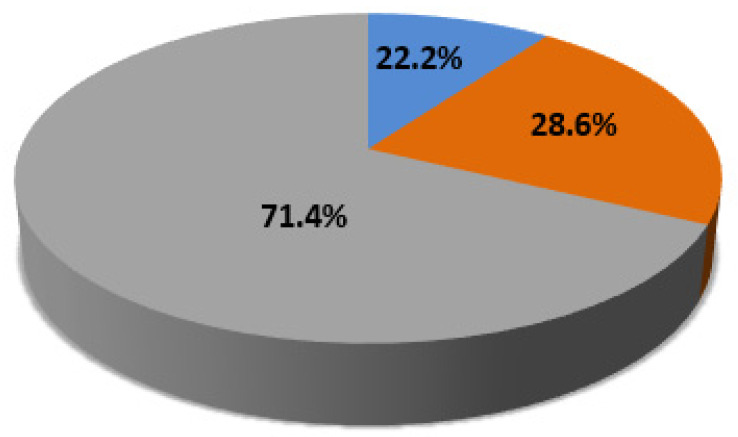
Figure 1.
Graphical representation of chromosome microarray analysis (CMA) results in our group of 90 females affected by autism. In the pie chart is depicted the percentage of individuals with causative copy number variants (C-CNVs), non-causative copy number variants (N-CNVs) or without copy number variants (w-CNVs).

