Fig. 5.
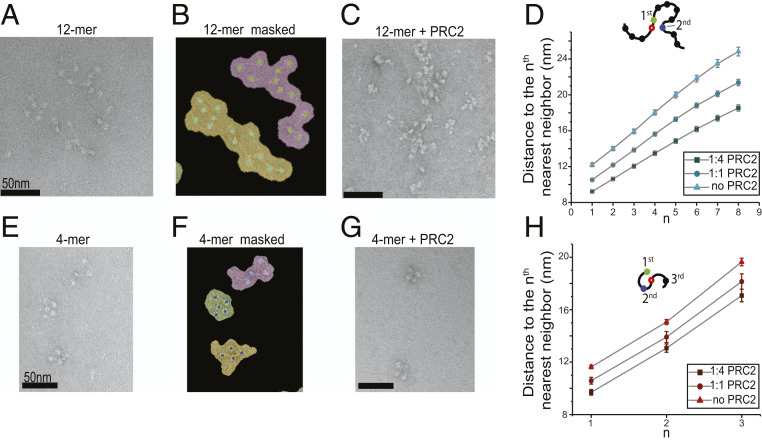
PRC2 mediates the compaction of polynucleosomes. (A) A representative negative-stained electron micrograph of 12-mer nucleosome arrays. (B) The same micrograph as in A with binary masks depicting individualized nucleosome arrays. Nucleosomes inside their corresponding masks are shown as colored dots. (C) A representative micrograph of 12-mer arrays incubated with PRC2 at 1:4 molar ratio (150 nM array and 600 nM PRC2). (D) Average distance between a reference nucleosome (open circle) and its nth nearest neighbor within the same 12-mer array measured at different array:PRC2 mixing ratios. A total of 95 masks from 14 micrographs were analyzed for the 1:4 array:PRC2 ratio, 121 masks from 10 micrographs for the 1:1 array:PRC2 ratio, and 98 masks from 14 micrographs for the no-PRC2 condition. A higher PRC2 level correlates to a shorter distance, indicating a higher degree of array compaction. (E) A representative electron micrograph of tetranucleosome arrays. (F) The same micrograph as in E with binary masks depicting individualized arrays. (G) A representative micrograph of tetranucleosome arrays mixed with PRC2 at 1:4 molar ratio. (H) Average distance from a reference nucleosome (open circle) to its first, second, and third nearest neighbor within the same tetranucleosome array measured at different array:PRC2 mixing ratios. A total of 103 masks from 10 micrographs were analyzed for the 1:4 array:PRC2 ratio, 99 masks from 12 micrographs for the 1:1 array:PRC2 ratio, and 371 masks from 19 micrographs for the no-PRC2 condition. Data are presented as mean ± SEM.

