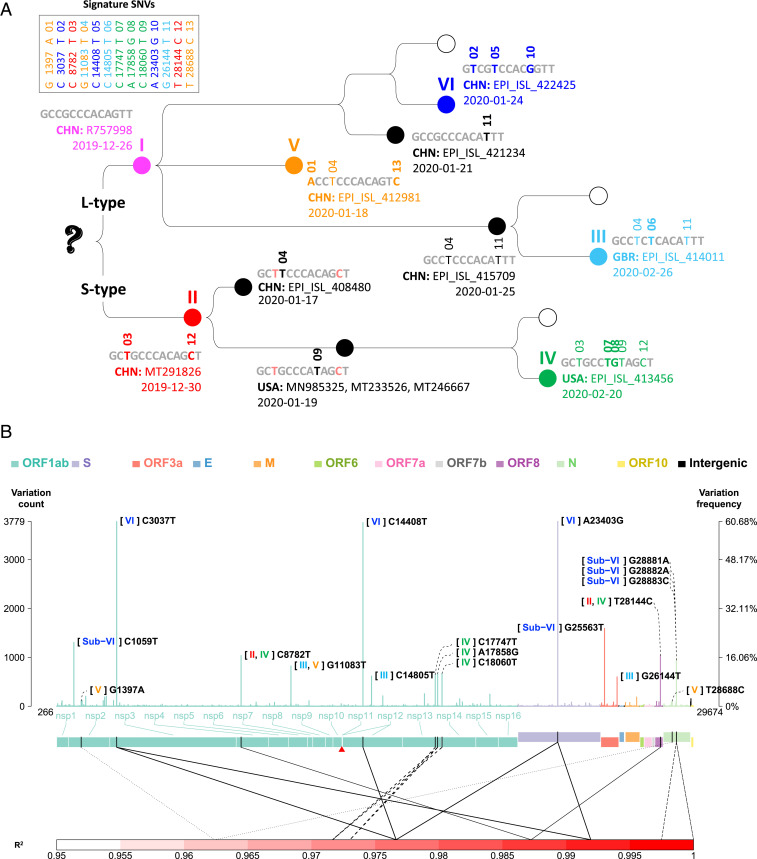
Fig. 3.
Signature SNVs. (A) Emergence history of the 13 signature SNVs in protein coding regions and six types. For each strain type, the signature SNVs, first observation time, country, and strain name are shown. (B) Genomic profile of the average variation counts per sample across the viral genome. In each site, the left-hand-side vertical axis indicates the total counts of variations at a site. The right-hand-side vertical axis indicates variation frequency, that is, the average variation counts per sample (i.e., the number of variations that occurred at a site in all viral strains divided by the number of strains). Variations in different gene regions are displayed in different color. A red triangle indicates the starting site of −1 ribosomal frameshift signal in ORF1ab. Two ends (5′ leader and 3′ terminal sequences) are not shown. Pairwise allelic association (R2) is shown only for the pairs of the signature and subtype SNVs with an R2 value of >0.95, and the same line type is used to indicate a pair of SNVs with strong allelic association.

