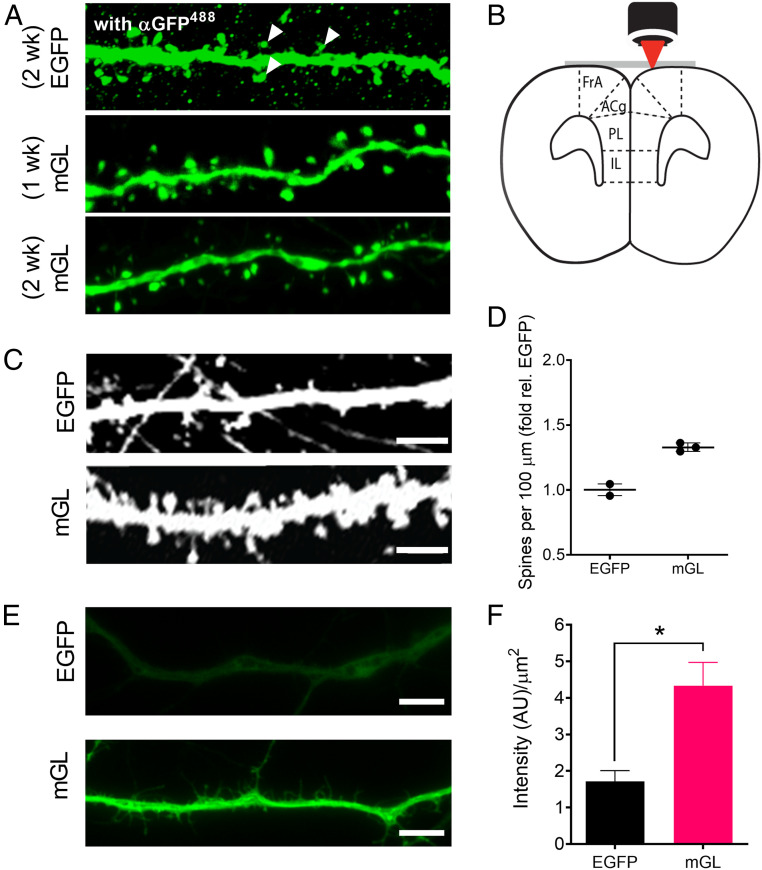
Fig. 4.
mGreenLantern (mGL) improves visualization of neuronal morphology in vivo and ex vivo. (A) Representative mGL-expressing neurons in ACA after 1- and 2-wk expression without antibody enhancement, compared to EGFP stained with α-GFP antibody at 2 wk. White wedges suggest the difficulty of distinguishing true neuronal substructures from background puncta after immunohistochemistry (IHC). Confocal microscopy, nonidentical gain settings. Magnification, 100×. (B) Schematic for two-photon (2P) imaging of the living mouse brain through a surgically implanted cranial window. (C) Representative images of neurons expressing EGFP and mGreenLantern in the cortex of live mice using 2P microscopy through a cranial window. Identical imaging settings. (Scale bar, 5 µm.) (D) Density of dendritic spines observed per 100 µm, normalized to EGFP. n = 95 and 101 neurons quantified from two and three mice for EGFP and mGreenLantern, respectively (mean ± SD). (E) Representative widefield images of neurons dissected from E17 mouse hippocampus and transduced with AAV2/1-CAG-EGFP or mGreenLantern virus after 10 d of culture. The neurons were fixed with PFA and imaged using identical excitation and acquisition settings with a standard EGFP filter set. Magnification, 63×. (Scale bar, 25 µm.) (F) Brightness of primary neurons from a minimum of three independent cultures, each with 20 random images quantified per condition. Mean ± SEM; Student’s t test, *P < 0.05.

