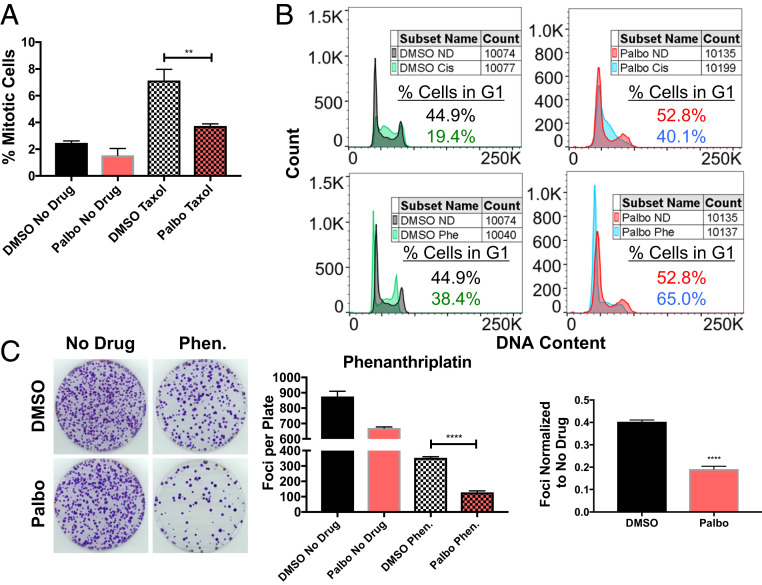
Fig. 4.
Mechanisms of G1 delay induced chemotherapy resistance. (A) HCT116 cells were pretreated with 5 μM palbociclib or DMSO for 24 h, and then incubated with 20 nM paclitaxel for 24 h in the presence of DMSO or palbociclib. Cells were then stained with 10 μM Hoechst 33342 and at least 200 cells/well were counted to determine the percentage of cells with condensed, mitotic chromosomes (n = 3 wells). (B) HCT116 cells were treated with 5 μM palbociclib or DMSO for 24 h, followed by incubation with 20 μM cisplatin (cis), 3 μM phenanthriplatin (phe), or no drug (ND) in the presence of DMSO or palbociclib for 24 h. Cells were then washed with PBS, fixed in 70% ethanol, stained with DAPI, and at least 10,000 cells were analyzed by flow cytometry. No-drug sample plots are shown twice for comparison to each drug-treated plot. (C) HCT116 cells were treated with 5 μM palbociclib or DMSO for 24 h, and then incubated in medium containing 3 μM phenanthriplatin (Phen.) in the presence of DMSO or palbociclib for 24 h. Cells were allowed to recover for 24 h in DMSO or palbociclib containing medium, before plating to determine their ability to form foci (n = 3). Representative images on Left, quantifications Middle, and normalized quantifications Right. Unpaired t tests (**P < 0.01, ***P < 0.001, ****P < 0.0001).

