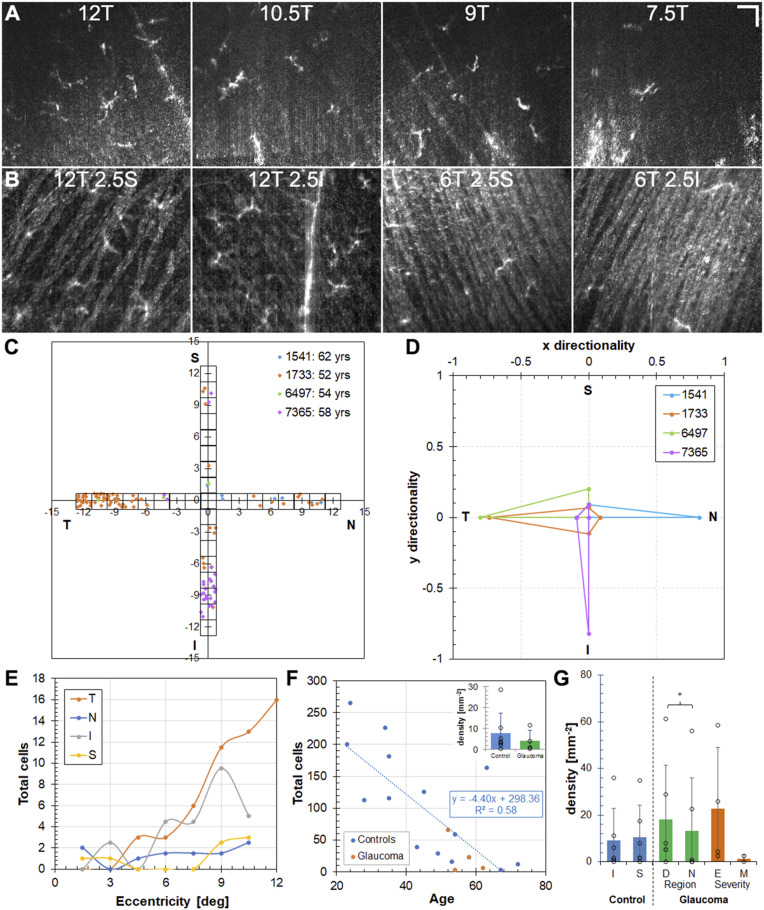
Fig. 5.
Macular ILM macrophage distribution in glaucomatous eyes is similar to that in controls but with regional differences. (A and B) Example AO-OCT images near the temporal distribution peak (A) and around the horizontal meridian (B) at 12T and 6T in a 52-y-old glaucoma subject. (Scale bar: 50 µm.) (C and D) ILM macrophage distribution maps (C) and symmetry plots (D) for four glaucoma subjects. (E and F) Total ILM macrophage counts in the regions surveyed as a function of eccentricity for the four quadrants (glaucoma subjects) (E) and age (all subjects) (F). (Inset) Average density across all distribution regions for four glaucoma subjects compared with seven age-matched control subjects. P = 0.27, Student’s t test. (G) Comparison of ILM macrophage density for 3°/6°/12° regions in six age-matched control and six glaucoma subjects. P = 0.25 for S-I, P < 0.01 for D-N, P = 0.23 for E-M, Student’s t test. S, superior; I, inferior; D, defect region; N, more normal region; E, early; M, moderate.

