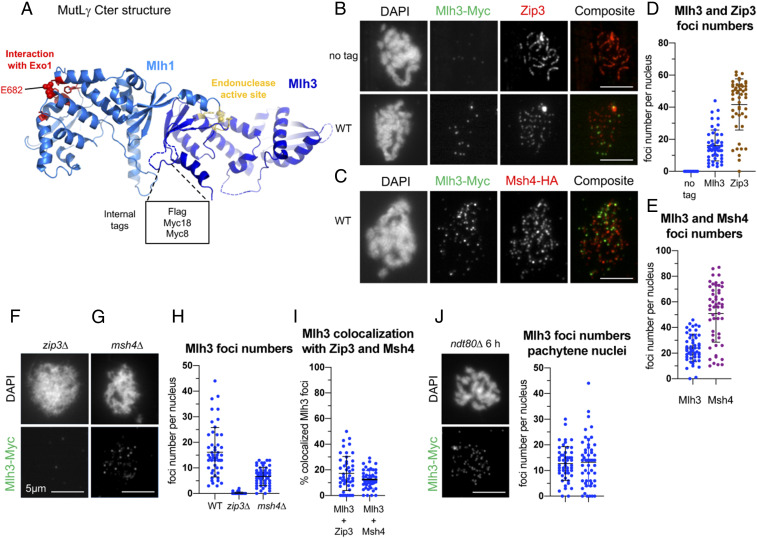
Fig. 1.
Mlh3 forms foci on yeast pachytene meiotic chromosomes, distinct from ZMM foci. (A) Crystal structure of the C-terminal region of Saccharomyces cerevisiae Mlh1–Mlh3 heterodimer showing the position of the internal tags in Mlh3. The Mlh1 and Mlh3 regions are colored in light and dark blue, respectively. The Mlh1 binding motif for Exo1 and the endonuclease site of Mlh3 are colored in red and yellow, respectively. (B) Comparison of Mlh3–Myc18 and Zip3 foci. (C) Comparison of Mlh3–Myc18 and Msh4-HA foci. (D and E) Quantification of Mlh3, Zip3, and Msh4 foci from B and C. (F and G): Mlh3-myc foci in zip3∆ (F) and msh4∆ (G). (H) Quantification of Mlh3-Myc foci in zip3∆ and msh4∆ mutants from B, F, and G; 51 nuclei examined in each. (I) Colocalization quantification of Mlh3 with Zip3 or Msh4 foci. The percent of Mlh3 foci colocalizing is indicated. (J) Quantification of Mlh3 foci in pachytene-selected nuclei of wild-type (same as in B) and ndt80∆; 51 nuclei examined in each. (B–J) All experiments at 4 h in meiosis, except ndt80∆ (6 h in meiosis). Scale bars: 5 μm. See also SI Appendix, Fig. S1.

