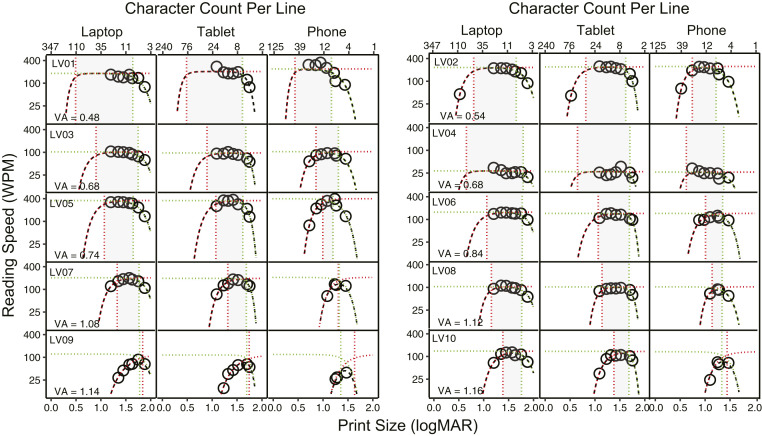
Fig. 4.
The reading curves of low-vision participants. The measured reading speeds are represented by circles. The red and green dashed curves (fitted by Eq. 1 and Eq. 2) illustrate the impact of print size and character count on reading speed, respectively. The black dashed curve is the actual reading curve jointly affected by print size and character count (fitted by Eq. 3). The red and green vertical lines represent the CPS and CCC corresponding to 80% of the MRS, and the gray area between them is the range of print size for near-MRS (at 80% of the MRS). Note that for some combinations of severe vision loss and display format (e.g., all three displays for subject 9 and phone format for subject 10), there is no recommended print size range.

