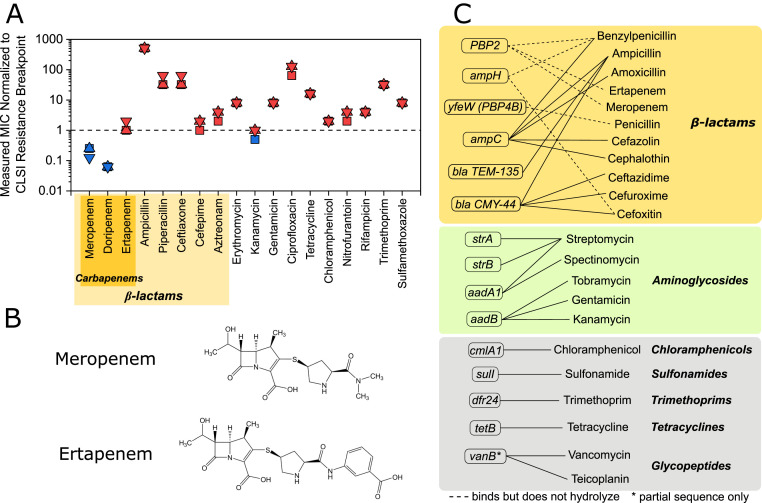
Fig. 1.
Resistance profile and resistance genes of E. coli CUS2B. (A) MIC of E. coli CUS2B for 18 antibiotics. The concentrations are shown normalized to the Clinical & Laboratory Standards Institute (CLSI) resistance break point for each of three replicates. Values greater than or equal to one indicate resistance, while values less than one indicate intermediate resistance or susceptibility. (B) Structure of meropenem and ertapenem. (C) Antibiotic resistance genes identified in CU2SB from whole-genome sequencing data. Solid lines: antibiotics to which the gene product confers resistance; dotted lines: antibiotics to which the gene product binds but has not been shown to hydrolyze.

