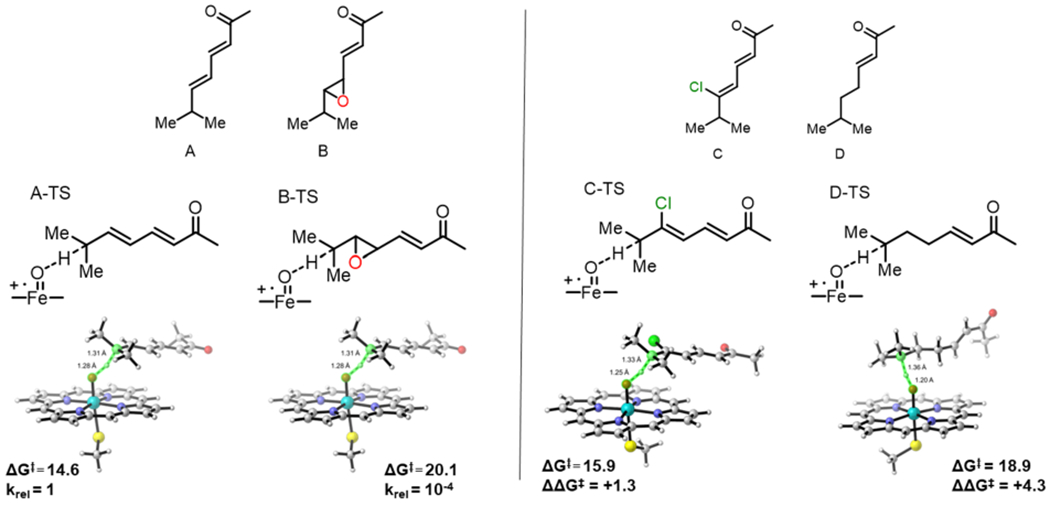
Figure 2.

Left panel: free energies (in kcal/mol) and transition structures of C-H abstraction from substrate models A and B. Right panel: substrate models C and D (top) and the respective transition structures with transition state free energy barriers (ΔG‡) and difference from A-TS (ΔΔG‡) for C-TS and D-TS (bottom).
