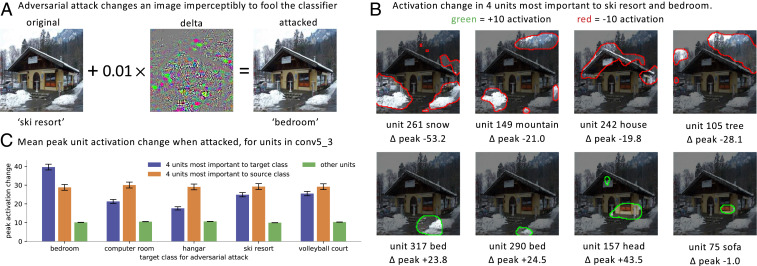
Fig. 5.
Application: Visualizing an adversarial attack. (A) The test image is correctly labeled as a ski resort, but when an adversarial perturbation is added, the visually indistinguishable result is classified as a bedroom. (B) Visualization of the attack on the four most important units to the ski resort class and the four units most important to the bedroom class. Areas of maximum increase and decrease are shown; indicates the change in the peak activation level for the unit. (C) Over 1,000 images attacked to misclassify images to various incorrect target classes. The units that are changed most are those that dissection has identified as most important to the source and target classes. Mean absolute value change in peak unit activation is graphed, with 99% CIs shown.

