Fig. 4.
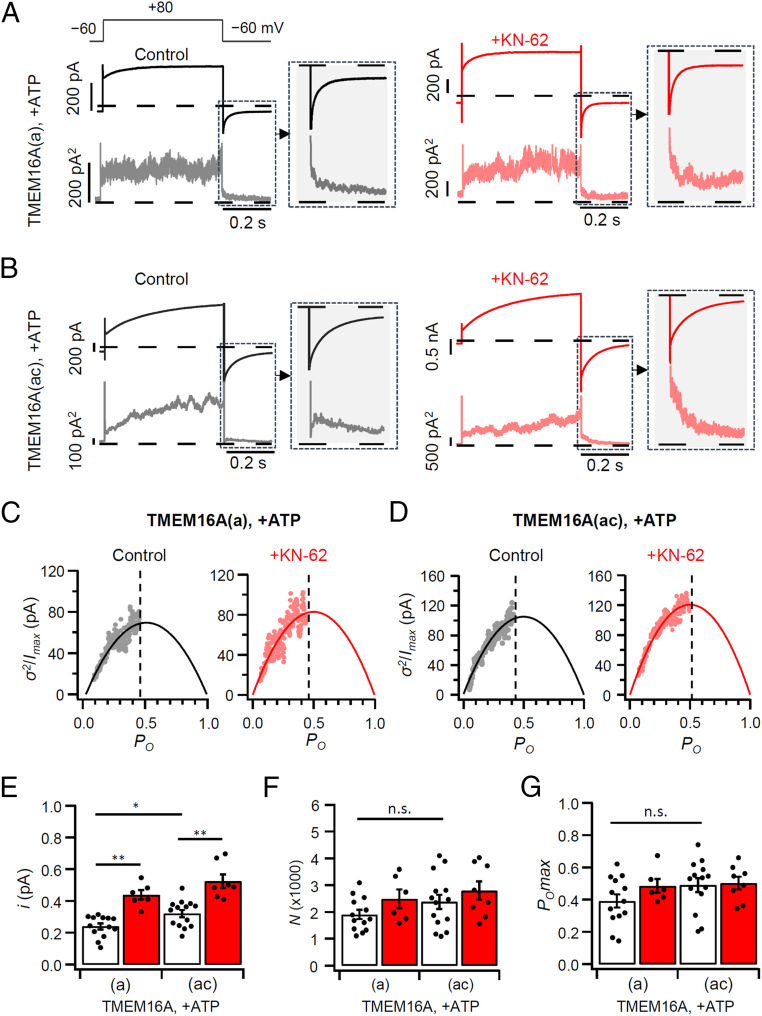
NSNA during deactivation of TMEM16A currents. (A and B) Representative mean current (top trace) and variance time courses (bottom trace) obtained during control (black) and +KN-62 (red) conditions in cells expressing TMEM16A(a) (A) and TMEM16A(ac) (B). Currents were elicited using a 200-ms voltage step to −60 mV after a 500-ms pulse to +80 mV. (C and D) Normalized variance (σ2) for the maximal current (Imax) plotted against open probability (PO) for traces recorded in control cells or treated with KN-62. The solid lines are the best fit of the data to the parabolic equation. The dashed lines indicate the POmax. (E–G) Bar graphs showing the single-channel current i (E), the number of channels N (F), and the open probability PO (G) of TMEM16A(a) and TMEM16A(ac) obtained from control (open bars) and +KN-62 (red bars) conditions (n = 6–14). All experiments were conducted at 115 nM [Ca2+]i and in the presence of ATP. The dots are the individual data points for each cell. The bars are mean ± SEM. n.s., not significant. *P < 0.05, **P < 0.01, one-way ANOVA followed by Sidak’s post hoc test.

