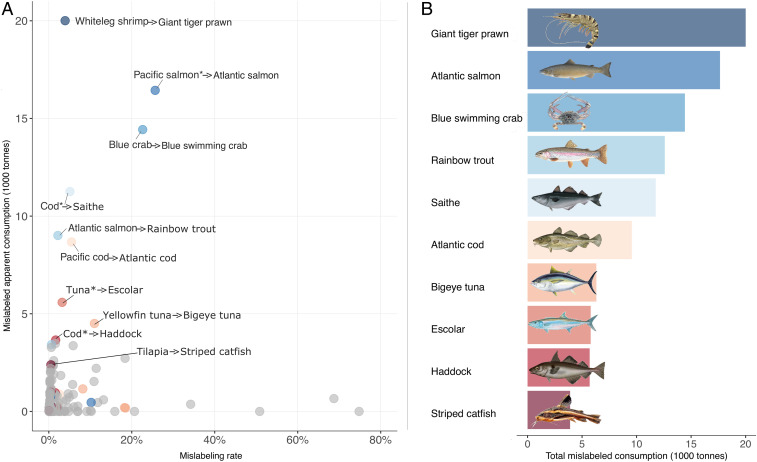
Fig. 1.
Mislabeling and apparent consumption for the US seafood supply. (A) Estimated mislabeling rates and mislabeled apparent consumption for pairs of seafood products where the expected product has been tested for mislabeling in the United States. The horizontal axis is the mode mislabeling rate for each pair, while the vertical axis is the resulting apparent mislabeled consumption. Products with high rates have low consumption and vice versa. The majority of pairs have relatively low rates and low consumption. Pairs with high mislabeled apparent consumption are labeled to show the expected and substitute products (expected substitute). Colored points represent pairs that contribute to the substitute products that have the highest total mislabeled consumption in B. (B) Of the substitute products that have been identified in the United States, the top 10 make up 55% of the total estimated mislabeled consumption. The total mislabeled consumption for each substitute product is calculated by grouping the pairs by substitute product and summing the mislabeled apparent consumption. The expected products Pacific salmon*, Cod*, and Tuna* represent more than one species. Common names follow Fishbase (18) and Sealifebase (19).

