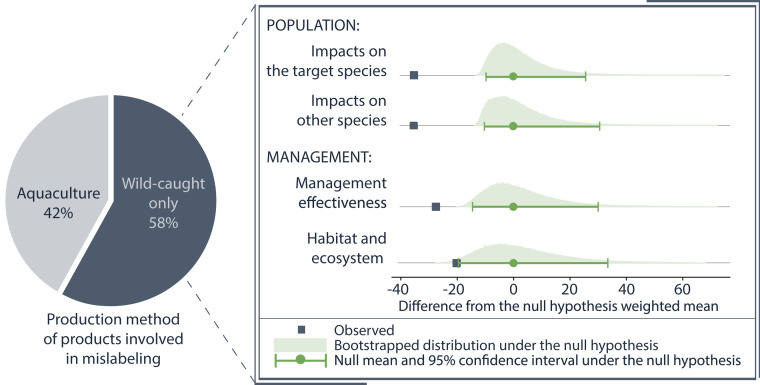
Fig. 3.
Estimated production method and population and management performance of seafood products involved in mislabeling. Approximately 40% of estimated mislabeled apparent consumption involves seafood products that can be produced via aquaculture (i.e., >1% of the expected or substitute product is farmed). The remaining about 60% of consumption involves exclusively wild-caught seafood products. For pairs exclusively involving wild-caught products, we compare the 95% confidence interval of the bootstrapped distribution under the null hypothesis that there is no difference between substitute products’ Seafood Watch scores and their corresponding expected product scores. Across all four scores, substitute product scores are consistently worse than expected product scores (). See Materials and Methods for information on the statistical tests.

