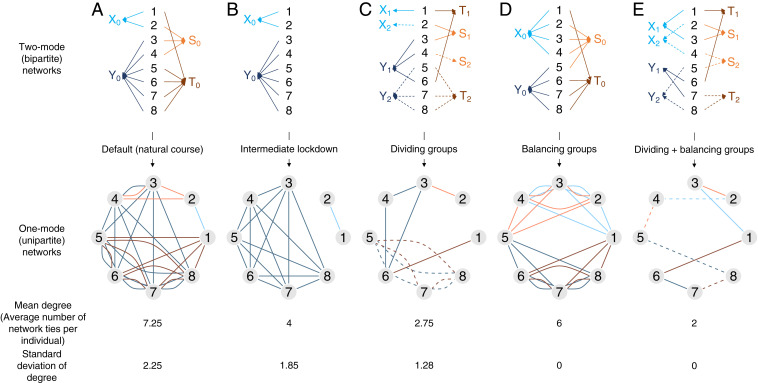
Fig. 1.
The two network intervention strategies (dividing groups and balancing groups). The flow is A → B, A → C, A → D, and C → E. We display a hypothetical network of eight people across two sectors (groups X and Y are in the same sector, and groups S and T are in the same sector). In the simulation, we used a network of 10,000 people across eight sectors. The two-mode networks (Top) show the distribution of group activities and sectors in which each subject (IDs 1 to 8) participates. For example, ID1 belongs to X0 (e.g., go to workplace X0) and T0 (e.g., go to supermarket T0) and regularly engages in his or her activities (e.g., working and shopping, respectively) at the appropriate locations (X0 and T0). The two-mode networks can be converted to one-mode networks (Bottom), in which a shared group connects two individuals. For example, ID1 and ID2 may be involved in transmission at X0 and the network tie between ID1 and ID2. A network tie in one-mode networks represents a chance of transmission, while an arrow in two-mode networks represents an individual going to a location and engaging in economic activities. In this example, the mean degree (number of the network ties per individual) and its variation (SD) are smaller when dividing groups (A → C) and balancing groups (A → D).

