Fig. 2.
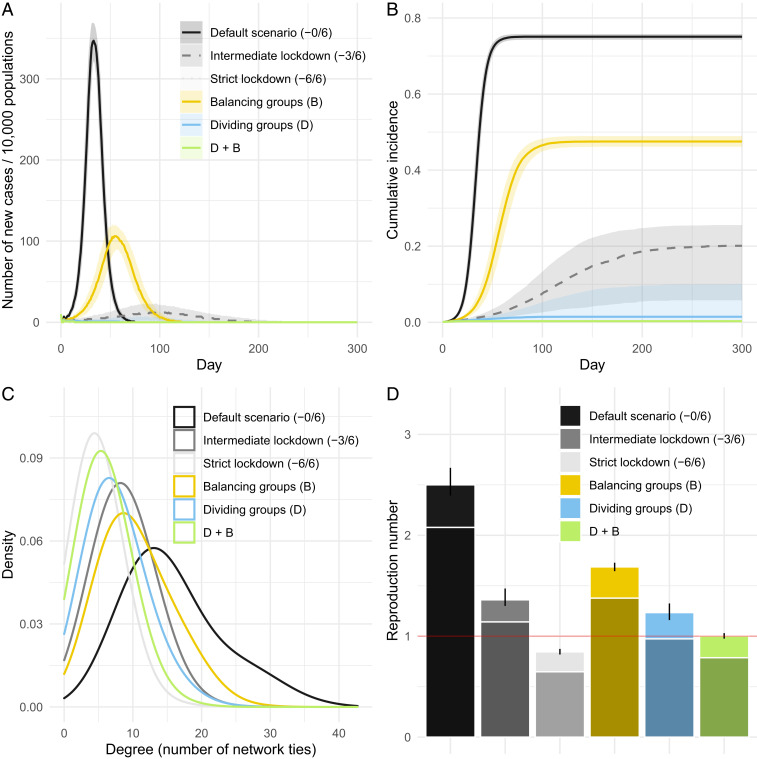
The results of agent-based simulations. (A) Incidence dynamics over 300 d. The lines and shades represent medians and interquartile ranges for 1,000 iterations of our simulation. The curves for the strict lockdown scenario and others are invisible because they are located near the x axis (this also occurs in B). The legend for A is shared with B. (B) Cumulative incidence dynamics over 300 d. (C) Degree distributions (density plots) in each scenario. Distributions are drawn using a single random seed for illustration purposes. (D) The network-based reproduction number in each scenario. Error bars represent the 95% QRs obtained from 1,000 simulations. The top, light parts of the bars show the increment effect due to the SD in the degree distribution (see Converting R0 to β for Agent-Based Simulations for details). The red horizontal line represents a reproduction number of 1.

