Fig. 3.
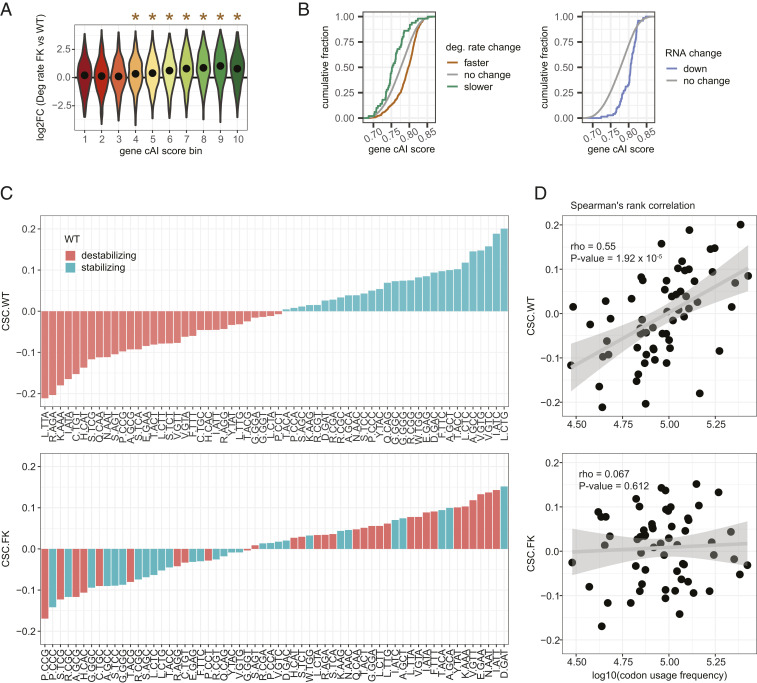
Increased mRNA degradation rates in FK neurons are codon optimality-dependent. (A) All mRNAs were grouped into 10 equal bins based on their gene cAI scores. Bin 1 contains genes with gene cAI scores of the lowest quantile, and bin 10 contains genes of the highest quantile. Violin plots show log2FC of degradation rates in FK vs. WT neurons for mRNAs in each gene cAI score bin. The point in each violin denotes the median of the bin. Brown stars indicate the median of the bin greater than 0 (Holm-adjusted P < 0.01, one-tailed t test). No bin had a median less than 0. (B) ECDF plots of gene cAI scores for mRNAs with faster or slower degradation rates in FK neurons (Left) or reduced mRNA levels in FK cortex (Right). (C) Bar graphs for CSCs for each codon arranged from minimum to maximum in WT (Upper) and FK (Lower) neurons. The color of each bar indicates the codon as stabilizing (CSC > 0; green) or destabilizing (CSC < 0; orange) in WT neurons. The amino acid for each codon is indicated. (D) Scatter plots and linear regressions of the CSCs as a function of log10(codon usage frequency) of the top 10% of expressed genes in WT (Upper) and FK (Lower) neurons. Spearman’s rank correlation coefficients and P values of the correlations are indicated.

