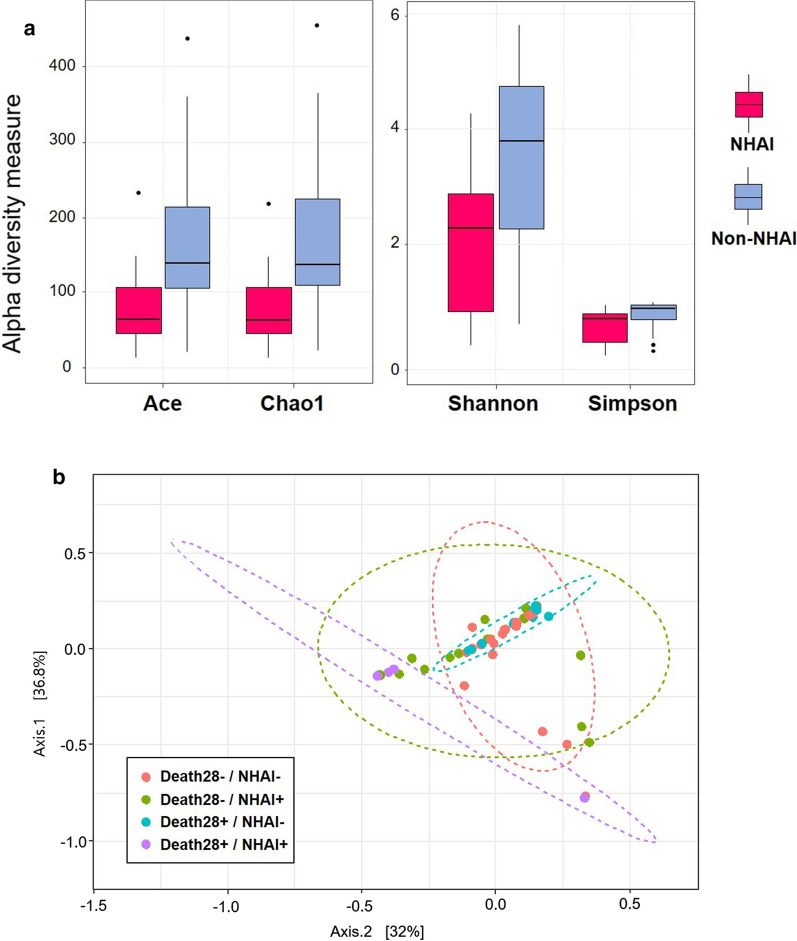
Fig. 3.
Differences in respiratory microbiome in NHAI group and non-NHAI group. a Comparison of the different metrics of α-diversity between the NHAI group (group 1) and non-NHAI group (group 0). For the lines in a box and whisker plot: the extreme bars are the overall range, the bottom and top of the box are the 25th and 75th percentiles and the line inside the box is the 50th percentile (median). b Microbial community structure in the endotracheal aspirates according to risk factors for NHAI based on weighted UniFrac distances. A PERMANOVA, performed using the Adonis function in the R package vegan) was conducted to compare the microbial community structure between the NHAI and non-NHAI groups. The x- and y-axis represent the first and second principal coordinates with the proportion of variance. The ellipses represent the 95% confidence interval for each group assuming a multivariate normal distribution. The analysis was adjusted for age, sex, APACHE score and Charlson Comorbidity Index score. ***p < 0.001 ****p < 0.0001

