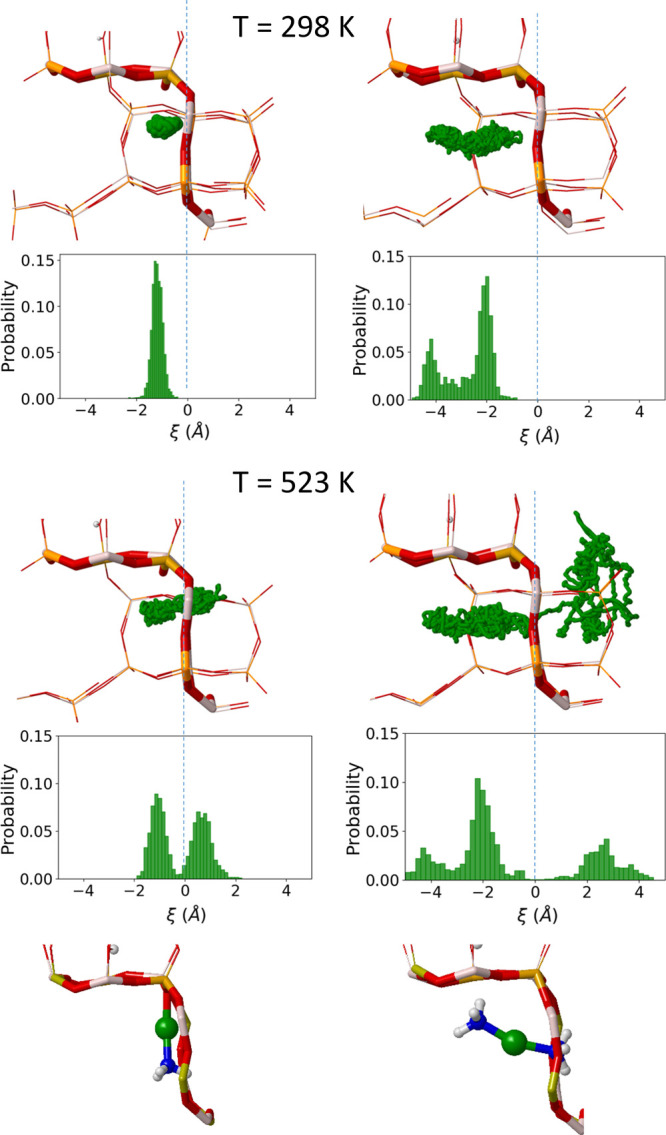
Figure 2.

Scatter plot of the position of Cu+ in the SAPO-34 cavity and probability distributions of the Cu-8r distance in AIMD simulations obtained over a 100 ps run for the interaction of Cu+ with one (left) and two (right) NH3 molecules at 298 and 523 K. Snapshots of the complexes are also shown. The ξ-axis represents the projection of the position of Cu+ on the vector normal to the average plane of the 8r.25 The centroid of the 8r is the reference coordinate such that when Cu+ is in the center of the 8r, ξ is equal to 0, indicated with a slashed vertical line.
