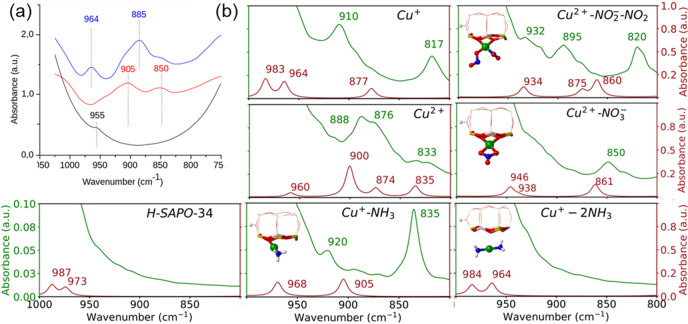
Figure 3.
(a) Vibrational νasym(T-O-T) region of the FTIR spectra of H-SAPO-34 (black line) and Cu-SAPO-34 preactivated in vacuum at 723 K (redline) or in O2 at 623 K followed by vacuum at 523 K (blueline). (b) Simulated vibrational spectra in the same region obtained from static DFT (red lines) and AIMD calculations at 298 K (green lines).

