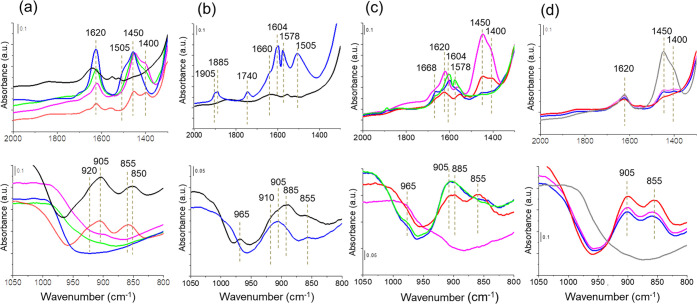
Figure 4.
FTIR spectra of Cu-SAPO-34 before (black lines) and after adsorption of different reactant mixtures. (a) 2NH3/Cu at 298 K (blue line) and increasing temperature to 423 K (green line), 523 K (pink line), and 623 K (red line). (b) 2NO/5O2/Cu at 298 K (blue line). (c) 2NO/5O2/Cu at 423 K (green line) followed by addition of 1NH3/Cu (blue line) and 2NH3/Cu (pink line) at 423 K and further increasing temperature to 523 K (red line). (d) 2NO/2NH3/Cu at 523 K (gray line) followed by addition of 5O2/Cu at 523 K (blue line) and increasing temperature to 573 K (pink line) and 623 K (red line). Prior to adsorption, the sample was preactivated in vacuum at 723 K for 2 h (a) or in O2 at 623 K for 2 h, followed by vacuum at 423 K for 1 h (b, c, and d).

