Fig. 5.

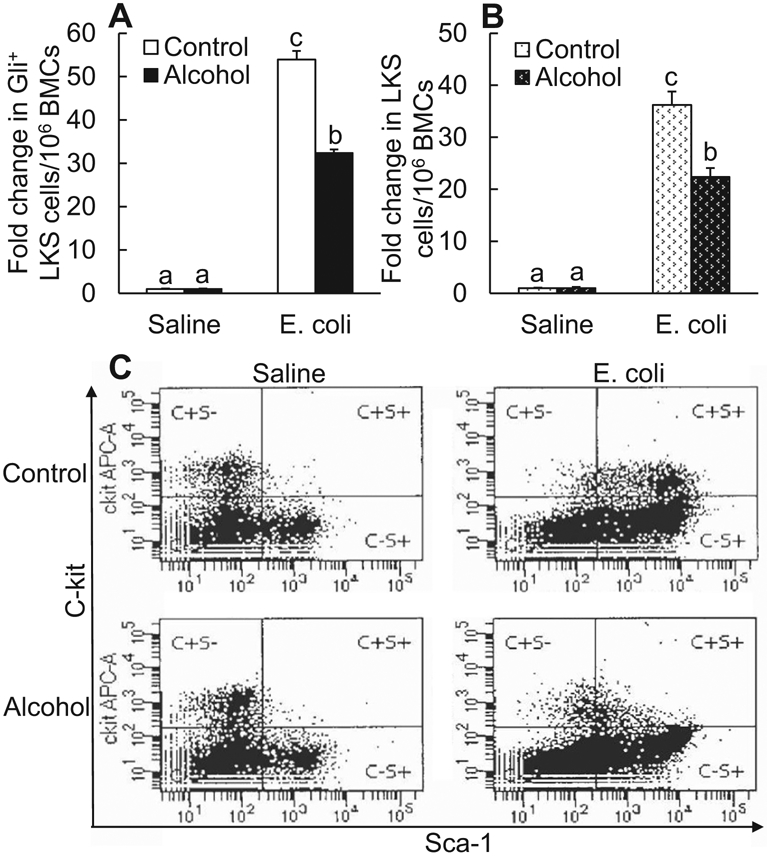
Acute alcohol intoxication suppressed increase in the number of Gli1+ LKS cells (A N = 4 in each group) and total LKS cells (B N = 10 in each group) in the bone marrow 24 hours following i.v. challenge with E. coli. Control: i.p. saline; alcohol: i.p. alcohol; saline: i.v. saline; E. coli: i.v. E. coli. Values are mean ± SEM. Bars with different letters in each panel of (A) and (B) are statistically different (p < 0.05). (C) Representative plots of flow cytometry about changes in bone marrow LKS cells.
