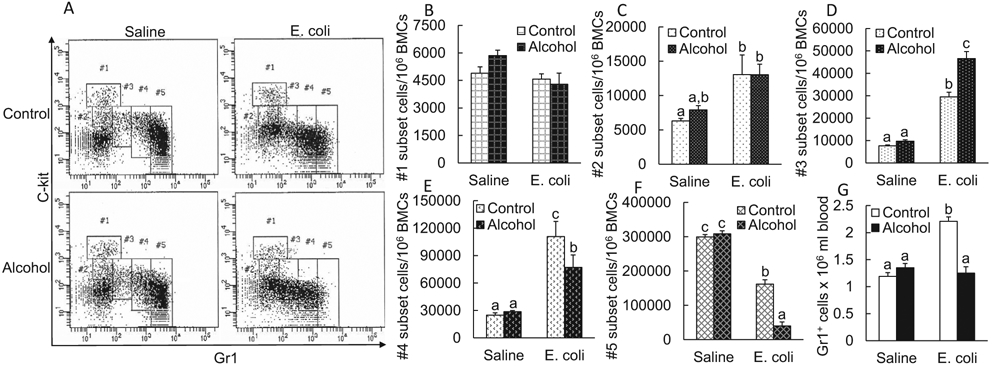
Fig. 7.

A. Representative plots of flow cytometry about change in cell subsets along granulocyte lineage development in the bone marrow 24 hours following i.v. challenge with E. coli in the absence and presence of acute alcohol intoxication. Control: i.p. saline; alcohol: i.p. alcohol; saline: i.v. saline; E. coli: i.v. E. coli. B-F Changes in cell subsets along granulocyte lineage development in the bone marrow 24 hours following i.v. challenge with E. coli in the absence and presence of acute alcohol intoxication. Control: i.p. saline; alcohol: i.p. alcohol; saline: i.v. saline; E. coli i.v. E. coli. N = 6 in each group. Values are mean ± SEM. Bars with different letters in each panel are statistically different (p < 0.05). (G) Changes in blood Gr1+ cell counts 24 hours following i.v. challenge with E. coli in the absence and presence of acute alcohol intoxication. Values are mean ± SEM. Control: i.p. saline; alcohol: i.p. alcohol; saline: i.v. saline; E. coli: i.v. E. coli. N = 6 to 8 in each group. Bars with different letters are statistically different (p < 0.05).
