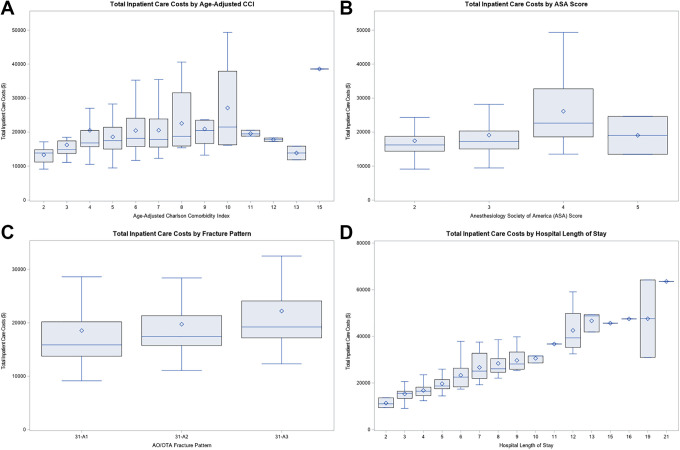
Figure 3.
Graphical visualization of the total incurred inpatient cost-of-care as a function of: (A) age-adjusted Charlson Comorbidity Index (ACC), (B) the American Society of Anesthesiologists (ASA) score, and the (C) AO Foundation/Orthopaedic Trauma Association (AO/OTA) fracture classification grade, and (D) the overall patient length-of-stay (LOS).

