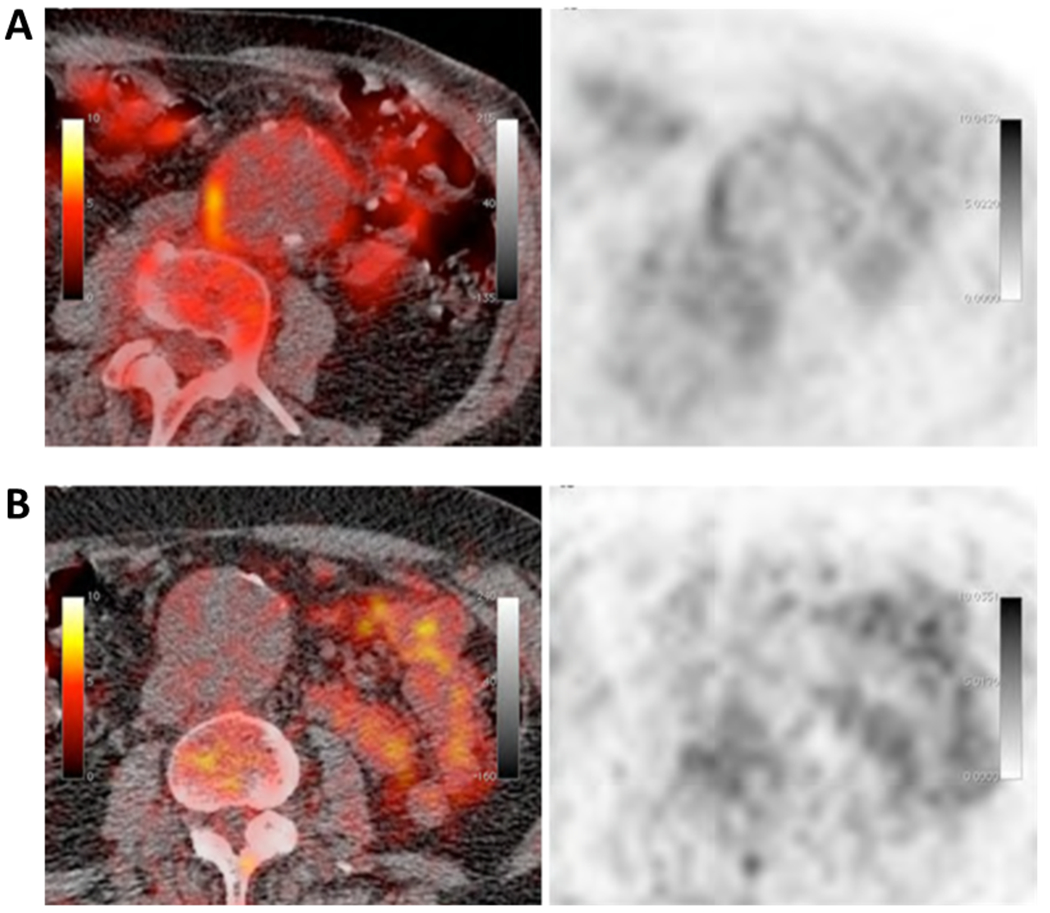
Figure 3: 18F-FDG PET imaging in AAA.

Axial fused PET/CT (left) and PET (right) images of an AAA showing high (A) or minimal (B) 18F-FDG uptake in the wall of the aorta. Reproduced from Kotze et al17 with permission from Springer.

Axial fused PET/CT (left) and PET (right) images of an AAA showing high (A) or minimal (B) 18F-FDG uptake in the wall of the aorta. Reproduced from Kotze et al17 with permission from Springer.