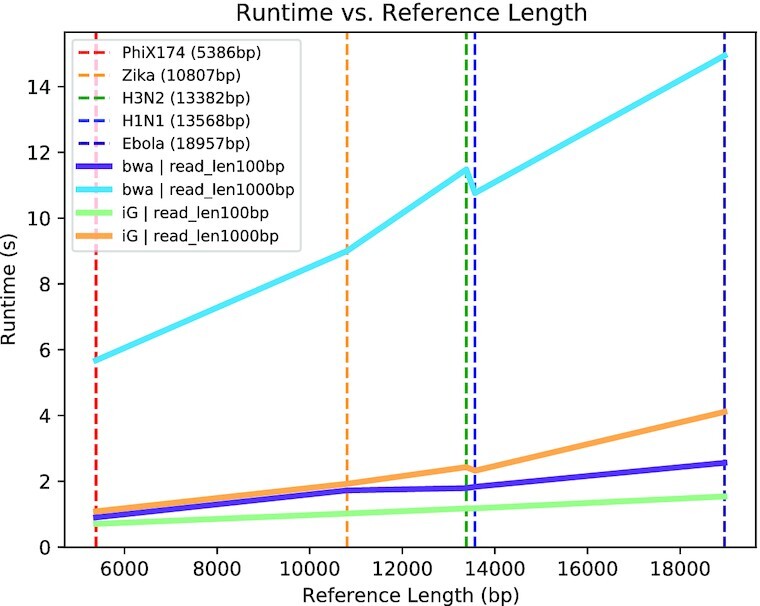
Figure 2:

Runtimes for simulated reads from 5 reference genomes. The datasets consisted of reads averaging 100× coverage and a reference file. Each dataset was tested, defined as aligning then variant calling, using iGenomics running on an iPhone and a BWA/SAMtools pipeline running on a laptop. The technical specifications of the iPhone and laptop used for testing are described in the Results section. Each trend line indicates the runtime for each dataset using the denoted alignment and analysis software; iG indicates iGenomics and bwa indicates the BWA/SAMtools pipeline. The dotted lines indicate the specific measurements recorded.
