Fig. 3.
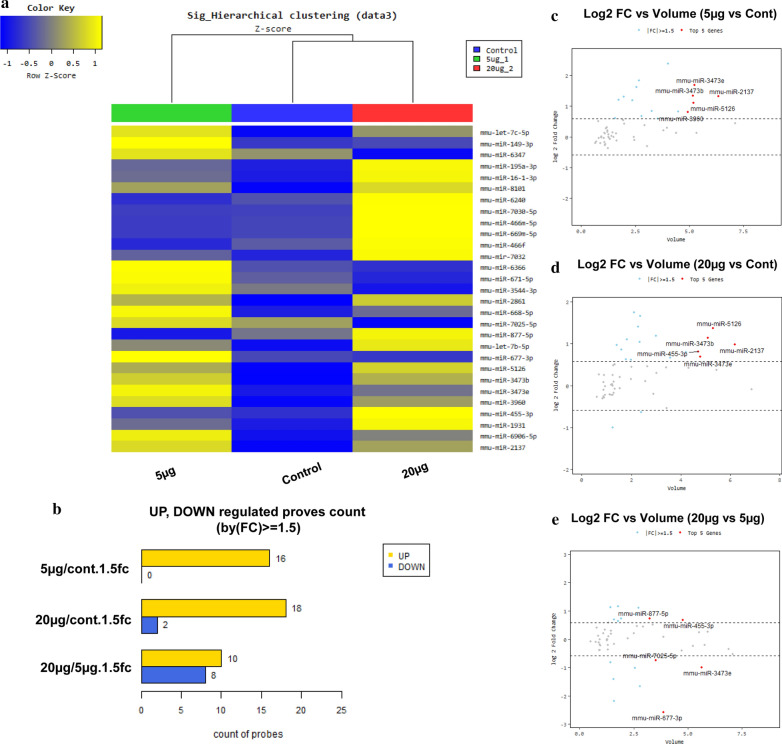
Analysis of exosomal miRNAs from MSCs exposed to 5 and 20 μg/mL PLGA-PEI PCS NPs. a Heat map with fold change values after different concentrations of NPs were added to MSCs for 24 h. b Number of miRNA probes that are increased or decreased (control and 5 μg/mL treatment, control and 20 μg/mL treatment, 5 and 20 μg/mL treatment). c The ratio of volume vs. fold change in the control and 5 μg/mL treatment. d The ratio of volume vs. fold change in the control and 20 μg/mL treatment. e The ratio of volume vs. fold change in the 5 and 20 μg/mL treatments

