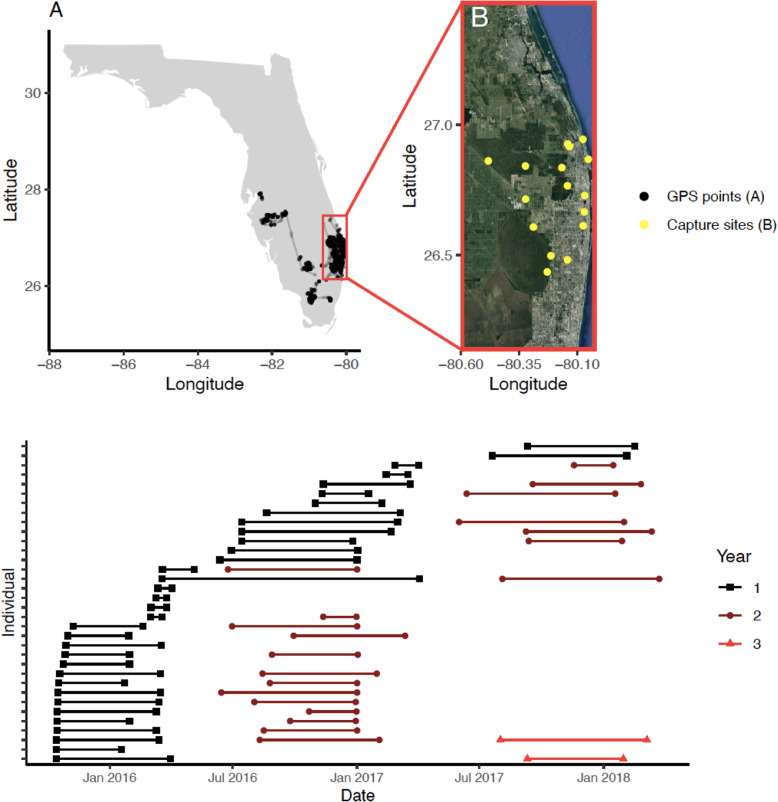
Fig. 1.
Study area and tracking data used in analyses. a All GPS tracking data (n = 46,111 points) for the nonbreeding season on a map of Florida, USA. The red outline shows the study area used in analyses. Tracks that fell entirely outside the study area (n = 5) were excluded because they were not connected to the core study area during an entire nonbreeding season. b Satellite imagery and capture site locations within the study area. c Nonbreeding season timing for each individual included in analyses across the study period. Each horizontal bar shows the timing (start and end) and duration of the nonbreeding season and each row is a unique individual. For individuals monitored for > 1 year, colored bars show the second year (circles) and third year (triangles) of monitoring

