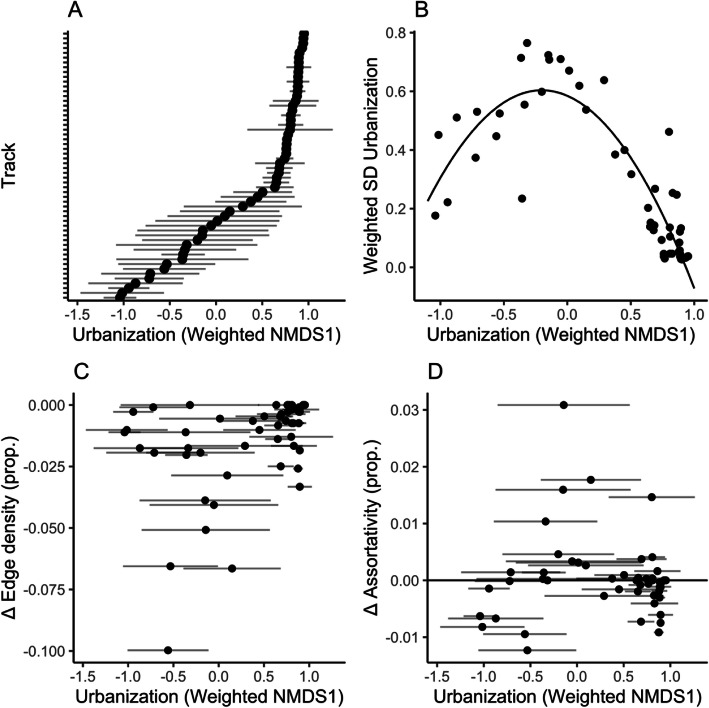
Fig. 3.
Individuals differ in their habitat use and their roles in network connectivity. a Weighted mean and weighted standard deviation of urbanization score (NMDS1) of all sites used by each individual bird-year. Individuals are sorted by their mean urbanization score. b Relationship between mean and standard deviation in weighted urbanization score. The curve shows the results from a linear model relating the two variables. c Relationship between an individual’s urbanization score and the change in edge density when they are removed from the network. Density can only decrease upon removal of an individual, so larger negative values indicate a larger influence of an individual on connectivity. d Relationship between an individual’s urbanization score and the change in assortativity when they are removed from the network. The horizontal line at y = 0 represents no change in assortativity

