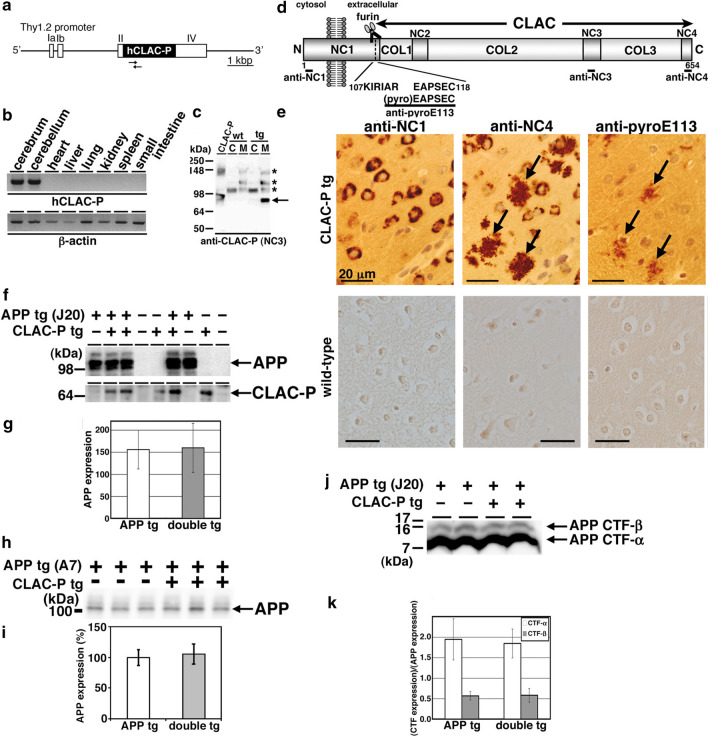
Fig. 1.
Generation of CLAC-P tg mice and APP/CLAC-P double tg mice. a A schematic structure of human CLAC-P (hCLAC-P) transgene using murine Thy1.2 promoter. The arrows show the location of human CLAC-P specific primers. Scale bar shows 1 kbp. b RT-PCR analyses in CLAC-P tg mice (line#74) using human CLAC-P (upper panel) and murine β-actin (lower panel) specific primers. c Immunoblot analysis of the brains of CLAC-P tg and its littermate wild-type mice (wt). Mice brains were extracted sequentially by Tris saline (cytosolic fraction, C) and 2% Triton X-100 (membrane fraction, M). Arrow shows the mobility of CLAC-P in HEK293 cells. Asterisks show the non-specific bands. d Schematic representation of the domain structure of human CLAC-P. The NC1 domain composed of cytoplasmic, transmembrane and extracellular portions, three extracellular non-collagenous domains (NC2, NC3 and NC4) and the three collagenous domains (COL1, COL2 and COL3) are shown. The epitope locations of the antibodies are shown in black bars. e Immunohistochemical analyses of cerebral cortex of 6-month-old CLAC-P tg (upper panels) or wild-type mice (lower panels) by anti-NC1, NC4, and pyroE113 human CLAC-P specific antibodies. The plaque-like structures are exclusively positive for the extracellular epitope of CLAC-P (arrows). Scale bar shows 20 μm. f, h Immunoblots of human APP and human CLAC-P in membrane fraction of the brains of double (J20 (f), A7 (h)) tg mice by anti-human APP antibody (BAN50 upper panel in f, 6E10 in h), or anti-CLAC-P antibody (anti-NC4 lower panel in (h)). g Densitometric analyses of the levels of full-length APP in the brains of APP (J20) and double tg mice. The mean ± SD N = 6 (APP), 7 (double). Student’s t-test, p = 0.89. i Densitometric analyses of the levels of full-length APP in the brains of APP (A7) and double tg mice. The mean ± SD is shown. N = 13 (APP), 9 (double). Student’s t-test, p = 0.90. j Immunoblot analysis of the APP CTFs (APP CTF-α and APP CTF-β) in the brains of APP (J20) and double tg mice by anti-APP C-terminus. k Densitometric analyses of the levels of APP CTFs (normalized by the levels of full-length APP). The mean ± SD N = 4 (APP), 3 (double) tg. Student’s t-test, p = 0.58 (APP CTF-α) and 0.71 (APP CTF-β)

