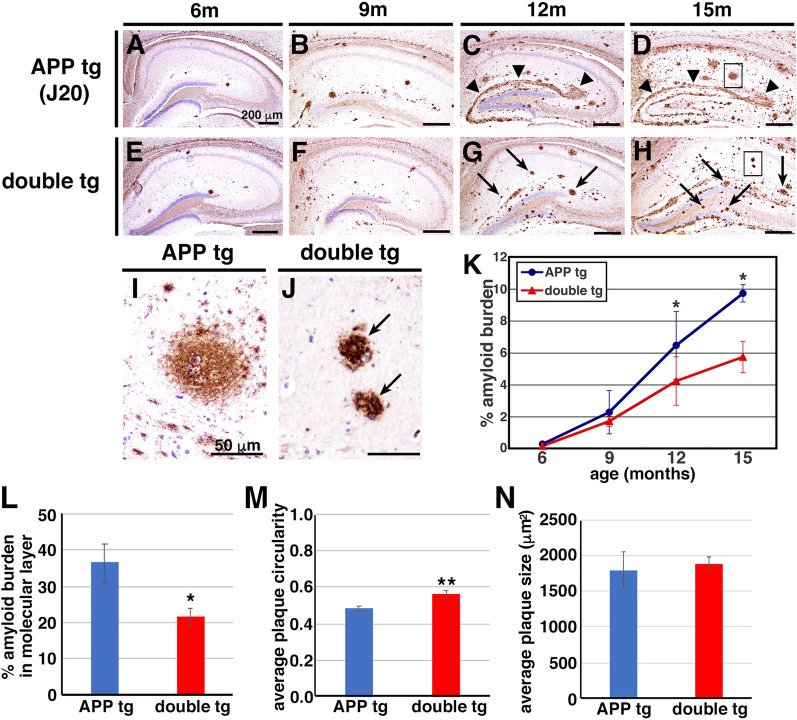
Fig. 2.
Overexpression of CLAC-P altered the morphology of Aβ deposits (J20 line). a–h Immunohistochemical analyses of the brains of 6- (a and e), 9- (b and f), 12- (c and g) and 15- (d and h) month-old APP tg mice (J20 line, a–d) and double tg mice (e–h) using an anti-human Aβ antibody (82E1). High magnification images (insets in d and h) were shown in i and j, respectively. Diffuse amyloid plaques (c and d, arrowheads) and huge plaques (i) were shown in the hippocampi of APP tg mice. On the other hand, numerous middle-sized plaques were predominant in the hippocampi of 12- and 15-month-old double tg mice (g, h and j, arrows). Scale bar shows 200 μm (a–h) and 50 μm (i and j). k Quantitative analysis of the amyloid burden (%Aβ immunoreactive areas) in the hippocampus of APP and double tg mice. N = 4, 4, 13, 7 for 6-, 9-, 12-, 15-month-old APP tg, respectively. N = 6, 3, 11, 7 for 6-, 9-, 12-, 15-month-old double tg, respectively. Mann–Whitney U test, p = 0.29 (6-month-old), 0.48 (9-month-old), 0.019 (12-month-old), 0.018 (15-month-old). l Quantitative analysis of the amyloid burden at the molecular layer of hippocampal dentate gyrus of 15-month-old APP and double tg mice. N = 6 (APP tg) and 7 (double tg). Student’s t-test, p = 0.024, *, p < 0.05 (m, n) Average circularity (m) and size (n) of Aβ plaques in the hippocampus of 15-month-old APP and double tg mice. Note that Circularity value of 1.0 indicates a perfect circle. N = 6 (APP tg) and 7 (double tg). Student’s t-test, p = 0.0076, **, p < 0.01 (n) N = 6 (APP tg) and 7 (double tg). Student’s t-test, p = 0.76

